Get 40% Off
👀 👁 🧿 All eyes on Biogen, up +4,56% after posting earnings. Our AI picked it in March 2024.
Which stocks will surge next?
Unlock AI-picked Stocks

Is Oil About To Explode Higher Or Move Sharply Lower?

Published 06/01/2015, 07:10 AM
Updated 07/09/2023, 06:31 AM

After four consecutive weekly doji candles, crude oil closed the month of May with a monthly doji / spinning top candle, enhancing the war between the bulls and bears over the near-term trend of black gold. Of May's four weekly candles, the first two saw bearish pressure and closed near the lows, whereas last week's candle saw bullish pressure and closed near the high.

The successful retest of the double bottom's neckline, around 54.00-56.50, has proven that there are still more buyers who believe that crude's price is attractive enough at these levels. The question, of course, is whether they outnumber the sellers, who believe that 60 is too expensive for crude oil.
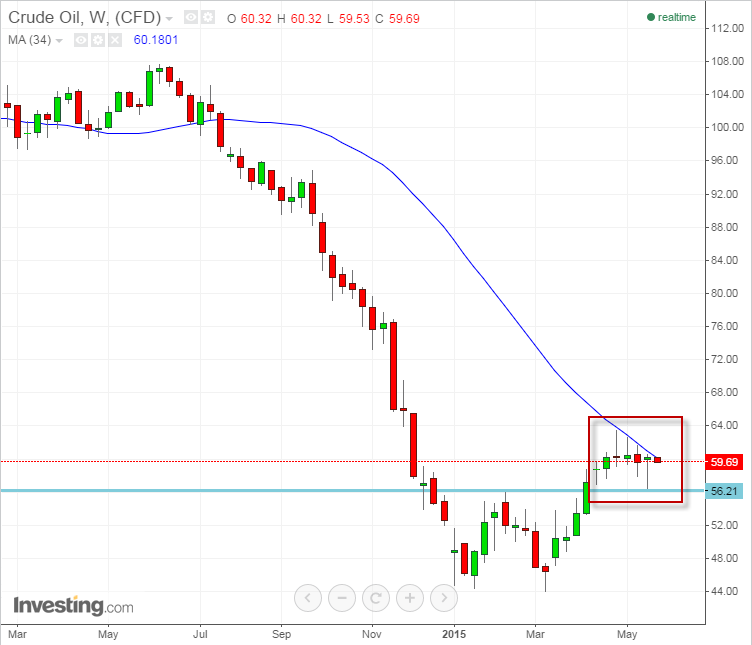
Crude Oil Weekly Chart

On the daily chart, the four weekly doji candles form a descending channel pattern which could be part of a bullish flag motif. If, on a daily basis, price closes above the upper trendline, we can expect a move up towards 64.80, 69.20 and even 74.00. None of these levels is a true supply zone, and the fast, sharp drop on the monthly and weekly charts from the levels of 105-107 hasn't left any traces of real supply zones, so there is no clear target for the move up, except for what was mentioned a month ago. On the other hand, closing below the aforementioned neckline, and particularly closing below the 54.00 level, may open the way for more losses toward 49.00 and then 44.00-45.00.
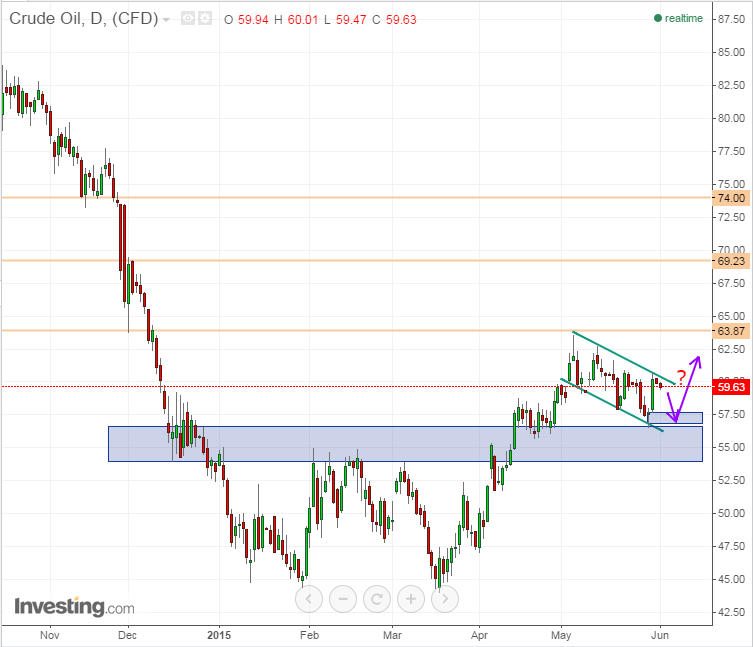
Crude Oil Daily Chart

A possible hint about crude oil's potential move up can be seen via the USD/CAD chart. The Canadian dollar is a commodity currency, which means it usually mirrors crude oil's trajectory. Bearish signals from the USD/CAD pair—meaning the CAD gains against the USD—could support bullish signals on the crude oil chart.

3rd party Ad. Not an offer or recommendation by Investing.com. See disclosure here or remove ads .

As can be seen on the monthly chart below, April's monthly bearish engulfing candle was formed at the monthly supply zone of 1.26-1.30—a classic bearish price action, which proves that there are plenty of sellers around 1.27-1.28.
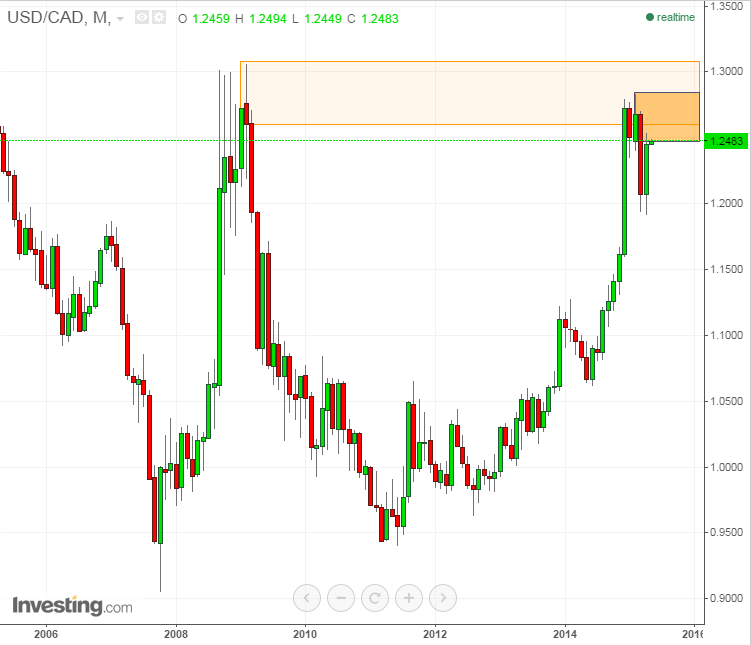
USD/CAD Monthly Chart

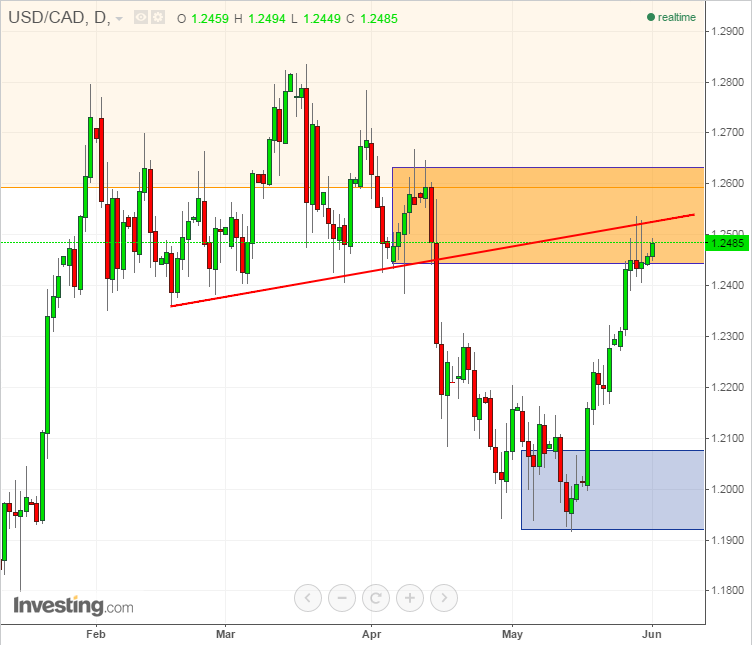
On the weekly chart we can see additional bearish engulfing candles, which shows how strong the sellers are around 1.24-1.28. This last supply zone, at 1.2450-1.2650, could serve as the base for another leg down toward 1.2070 and even lower. To go short, just wait for a daily reversal candle with a nice risk:reward ratio (stop-loss above 1.2650, targets around 1.2250 and then 1.2100.)
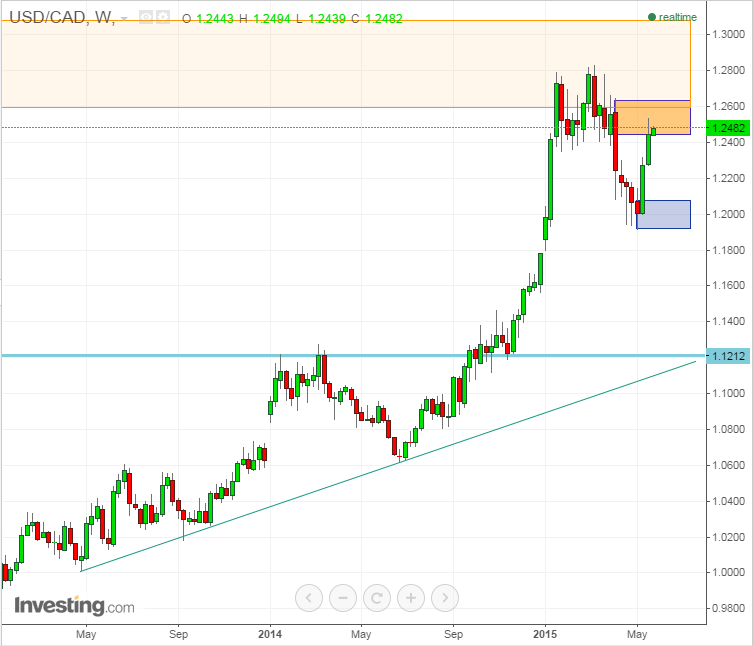
USD/CAD Weekly Chart

USD/CAD Daily Chart

Latest comments

Risk Disclosure: Trading in financial instruments and/or cryptocurrencies involves high risks including the risk of losing some, or all, of your investment amount, and may not be suitable for all investors. Prices of cryptocurrencies are extremely volatile and may be affected by external factors such as financial, regulatory or political events. Trading on margin increases the financial risks.
Before deciding to trade in financial instrument or cryptocurrencies you should be fully informed of the risks and costs associated with trading the financial markets, carefully consider your investment objectives, level of experience, and risk appetite, and seek professional advice where needed.
Fusion Media would like to remind you that the data contained in this website is not necessarily real-time nor accurate. The data and prices on the website are not necessarily provided by any market or exchange, but may be provided by market makers, and so prices may not be accurate and may differ from the actual price at any given market, meaning prices are indicative and not appropriate for trading purposes. Fusion Media and any provider of the data contained in this website will not accept liability for any loss or damage as a result of your trading, or your reliance on the information contained within this website.
It is prohibited to use, store, reproduce, display, modify, transmit or distribute the data contained in this website without the explicit prior written permission of Fusion Media and/or the data provider. All intellectual property rights are reserved by the providers and/or the exchange providing the data contained in this website.
Fusion Media may be compensated by the advertisers that appear on the website, based on your interaction with the advertisements or advertisers.
© 2007-2024 - Fusion Media Limited. All Rights Reserved.