The United Nations’ Programme on HIV/AIDS (UNAIDS) has a goal to eradicate AIDS by 2030. As researchers Jeffrey W. Eaton and James Hargreaves point out in a recent Lancet commentary, this is a “monumental challenge.” One of the most difficult facets of reaching the end of AIDS, they say, will be knowing when we’ve gotten there.
To reach the end of AIDS, UNAIDS’ target is “90-90-90” by 2020: “90% of people living with HIV know their HIV status, 90% of people who know their HIV-positive status are accessing treatment and 90% of people on treatment have suppressed viral loads.” Reaching this goal, according to Eaton and Hargreaves, will require extra attention to detail, especially as incidence of HIV becomes increasingly rare and more difficult to track.
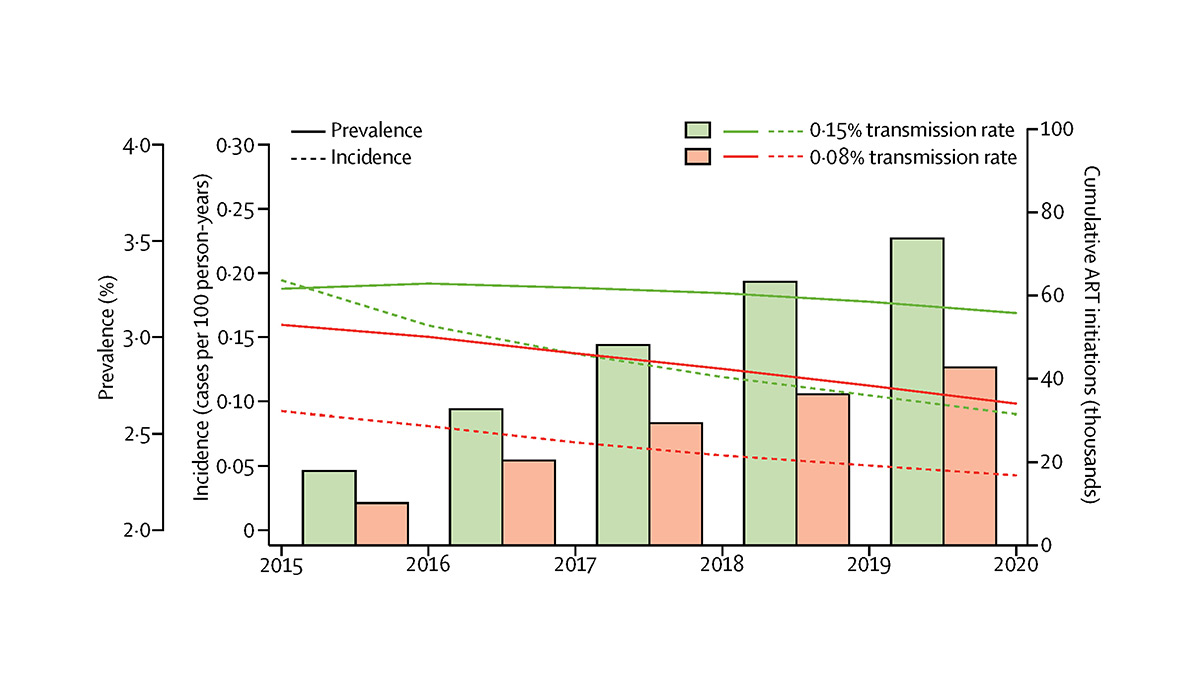
Eaton and Hargreaves use differing Rwanda’s seroconversion incidence data to illustrate why details are so important. In their 2016 Global Report, UNAIDS estimated and published a 0.15 per 100 person-years seroconversion incidence rate—meaning that every 1000 persons with unsuppressed HIV would result in eight new HIV infections per year at the current coverage levels of antiretroviral treatment (ARV). According to results reported in 2017 from the Rwanda HIV Incidence Survey, however, incidence of seroconversions was almost twice that of what UNAIDS estimated in its model.
The authors ask: is this a significant miscalculation or a natural byproduct of bias in the two studies? If the former is the case and the UNAIDS model is inaccurate, it would be difficult for policymakers and programs to correctly allocate resources to suppress HIV through ARV treatment. If the latter is the case, only 16 of the 12,000 Rwandans tested for HIV would have had to receive false positives for this discrepancy to become irrelevant.
Models like the one published by UNAIDS, then, would be more helpful if they were to analyze an array of scenarios. In the above graph, the authors add an additional model using the data from the Rwanda HIV Incidence Survey to show how many HIV-positive adults would need to be on antiretroviral therapy (ART) to meet the 90% treatment coverage goal by 2020, given two different assumptions. The orange data visualization uses the incidence rates of new infections that UNAIDS had published in 2016. The data visualized in green uses the rates found in Rwanda in 2013. If the green model is true, it will take much more treatment to reach the 90% coverage target.
The authors recommend that data regarding incidence and prevalence be more promptly collected, accurately measured, and explicitly reported. At the same time, scenarios that model anticipated progress, such as the one used in the UNAIDS 2016 Global Report, will have to be more versatile.
Databyte via Jeffrey W. Eaton and James Hargreaves, How Will We Get There? How Will We Know? The Lancet HIV.