


As of Friday last week, World Equities had lost $15 trillion in value (-7%), with almost two thirds of Global stocks now in “Bear market” territory (i.e. down 20% or more). In Wall Street, talk is already turning to the possibility of the “Powell Put” being in play – the idea that, should markets fall below a certain point, the Fed will ride to the rescue with rate cuts/money printing/buying assets directly etc. or whatever else is deemed necessary to ensure that asset prices don’t fall. As we pointed out a couple of weeks ago, asset prices appear to be the only relevant metric in policy decision-making – and don’t the markets know it!
The history of Central Bank interference in the process of asset price discovery dates back to the 1980’s and the rise of Alan Greenspan to the role of the head of the Federal Reserve; he got the job in August 1987 and, as often happens, fate intervened to “test” him – the Crash of October that year saw equities fall 20% + in one day, leading to panic across the world – the Fed signalled its readiness to provide liquidity to the financial system and the crisis passed, but the die was thus cast. The Mexican Peso crisis of 1994 and the Long Term Capital Management debacle of 1997/98 both led to Fed bailouts, ostensibly to avoid a financial system meltdown [2]. The approach of “allow bubbles to burst and then clean up the mess afterwards” was seen most clearly in the Technology bubble of 1998-2000, where aggressive rate cuts were followed by only mild tightening, creating the conditions for the Housing/Mortgage Bubble of 2006-09. The Fed’s “reaction function” was thus seen to be “cut first and answer questions later”, leading to risk-seeking speculation and the excesses so vividly recounted in the film “The Big Short”. The term “Bernanke Put” came to be seen as an extension of the previous practice as he developed new (and much more controversial) tactics such as Quantitative Easing (versions 1, 2 and 3) which involved the State (via the Central Bank) buying up vast amounts of bonds (and even equities in the Japanese variant) in order to stave off recessions (or worse). As it became Global in nature (adopted by the Bank of England, the European Central Bank and the Bank of Japan), world interest rates fell to zero (or below) – such that, as recently as May 2017, a staggering $9.5 trillion of Government bonds STILL had negative yields [3]. The advent of Janet Yellen to the Chairmanship (in 2014) saw more of (essentially) the same thing, erring constantly on the side of lower interest rates and higher inflation; in February 2018, Jerome Powell was appointed by Donald Trump to that role.
Their policies have had well-known consequences – long term interest rates and credit spreads are far below where they would be absent QE etc. whilst Debt Levels, Corporate Leverage and asset prices are far above this baseline. There are signs, however, that Powell is in the process of discarding the policy – and Donald J. Trump is not at all happy! He has described the Fed as “crazy” to be raising interest rates (though there has never been a sitting US President in history that favoured higher rates) and he is clearly intent on pressuring them to avoid the higher US Dollar that inevitably comes with it. Markets seem to be on his side, (though the same caveat applies here too!), as the Eurodollar Futures contract for December 2019 is now implying only 40 bps (0.4%) of rate rises for that year (versus the Fed’s expectations of 0.75%) and the 2020 contract now assumes a small “easing” in rates, far below the Fed’s forecasts – the markets appear to be pricing in a “policy error”, (or a market crash!) leading to interest rates having to fall once again.
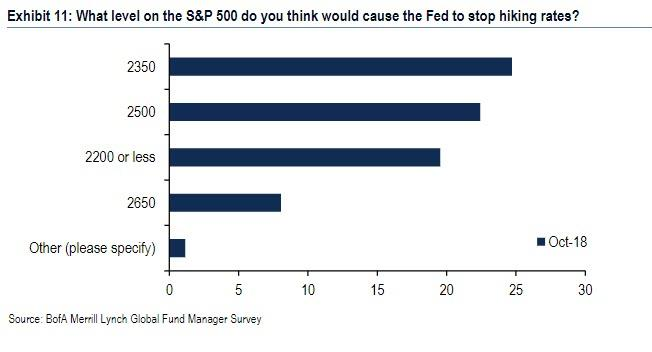
At present, markets are struggling – the S&P 500 had not had 2 days of consecutive gains for 27 days until this week, something that only happened 6 times since 1960. So far, Powell has shown no indication of relenting in his strategy of raising rates, whilst allowing the Fed’s Balance Sheet to shrink (by not re-investing the maturing bonds bought under QE). Analysts are now becoming increasingly bearish, with Morgan Stanley now looking for the S&P 500 to hit 2,400 (another 10% lower), by year-end. But this has led investors to begin to speculate on when (not if), the Fed will once again intervene to support share prices. The table below suggests that the majority expect the 2,350- 2,500 range to be the “strike price” of the Powell Put, that is, the point where the Fed will reverse course back to lower rates etc.
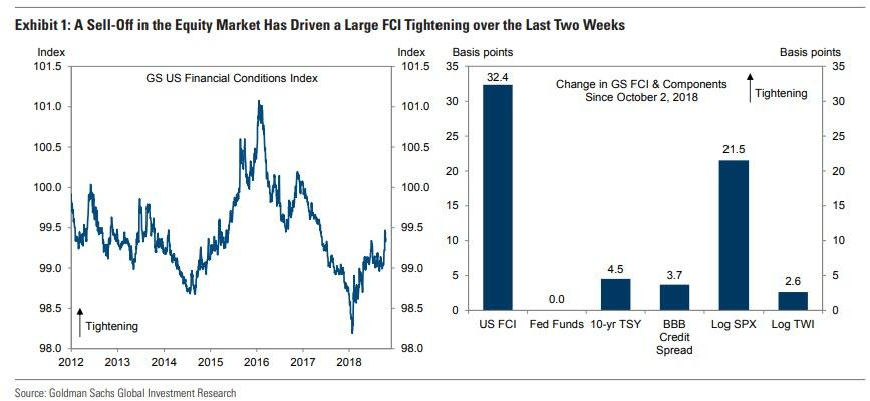
How do they arrive at this conclusion? It comes down to “financial conditions” – the notion that it is not just Interest rates that determine the ability of firms and individuals to borrow/invest, but other factors such as asset prices in general, (note the weighting of the S&P 500 (SPX) in that calculation), the willingness of banks etc to lend, the level of the US Dollar and so on. As the chart below (left) shows, despite successive interest rate rises since December 2015, it is only very recently that it has had a tightening effect on the economy (as share price rises and the tax cuts effect offset most of it). It may be of note that the Index bottomed in early 2018 and investors have seen two major market declines (February and October) since then.
It is of course more of an art than a science, as the range of likely trigger points above suggests. According to a Deutsche Bank analyst, a 16% market fall would be the equivalent of a 0.3% rate hike, which implies that a decline of this magnitude would lead to a Fed pause, but others argue it might only take a decline to 2,600 or so (as it happens the recent S&P 500 low was 2,603). But analyst opinions only differ as to the actual point of action, rather than the act of intervention itself – what if they are wrong? Powell himself has made it clear (in Fed meeting transcripts) that he was a reluctant advocate of QE3, worrying that its effects would not be “commensurate with the risks” and that it would be “habit-forming” for markets. He may have been wrong on the first of these but he has been proved spot on in the latter view. His silence during both the February decline and more recently has been marked – neither he nor the Fed seems overly concerned by recent events and it may take a much larger market fall to change their monetary stance; Charles Evans, the head of the Chicago Fed recently said that he wasn’t aware of “anything happening in the last couple of weeks that alters my basic take that financial stability conditions are reasonably moderate and that we’re in reasonable shape at the moment.” The prospect of increased tensions over trade, Russia or Iran have made no impact on their thinking it seems. With the economy steaming ahead, the jobless rate falling to near-record lows and wage pressures beginning to rise, it may take a major event to change their minds on monetary policy – an 11% peak to trough decline doesn’t seem to fulfill the criteria for action. So, even if a “Powell Put” exists, it may be much lower down than investors currently believe. (S&P 500 at 2,000?).
As of Thursday this week, however, the S&P 500 had risen c.6.1% off the low on Monday (+160 points), which may be either a sign of investors front-running [4] the Fed’s “rate cuts”, or that they are extremely dim – in so doing, they have thus loosened financial conditions sufficiently (using the Deutsche Bank formula above, by c. 11 basis points in the last 3 days alone), to put the Fed out of the (market support) picture and back in the game of raising interest rates, which will no doubt be the source of the next market tantrum. Nobody can accuse investors of overthinking…
[1] A Put option is a derivative that allows the holder to sell an asset at a pre-agreed price. As the price of that asset falls, the value of the Put option increases, providing protection for the owner of the option from price falls below that agreed level (or “Strike Price”).
[2] I use the word “ostensibly” because we do not have the counterfactual – what would have happened without the bailout? As it happens we still do not know because the bailout is now the modus operandi for all crises…
[3] See this link – Under Process – for details of how it was supposed to work.
[4] Front running is where traders/investors seek to buy (or sell) an asset simply because they anticipate that the Central Bank is about to do the same thing. It is made much easier by their policy of “guidance”, whereby they tell investors in advance what they are about to do…
