Getting Googley with Infographics

Rachelle Wooten @rwootenits
Stephanie Jernigan @sjerniganfbisd
Getting Googley with Infographics Presentation: https://docs.google.com/presentation/d/16VYXZvEWIjkOTTmMnQdcEQtA20Y5qhBVzyBokgay5g8/edit?usp=sharing
Infographics 101 1
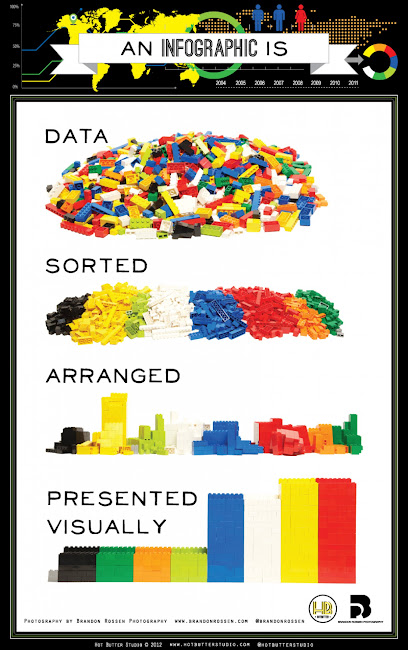
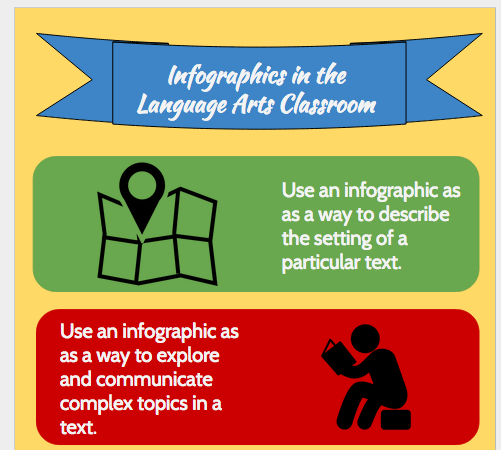
The image on the left communicates plainly what an infographic is through the use of an infographic. You may also want to view the video here to learn more about what an infographic is and how we are using them to communicate in a variety of industries. You may have seen them in newspaper or magazine articles. And, they are all over the web! I (Rachelle) love inforgraphics so much that I’ve created a Pinterest board dedicated to educational infographics. Feel free to explore and pin some of them here. You can also share some of these with your students so that they see some polished examples of what professional looking infographics look like.
Image credit: http://visual.ly/what-infographic-2
Infographics in the 21st Century Classroom
Infographics are a great way to promote creativity, collaboration, communication and critical-thinking. Because I’m so interested in this topic, I have come across some great articles and blog posts that may help you as you begin to use these in the classroom with your students. This one is from a language arts teacher, and it was found on Edutopia’s website. He provides steps and a sample draft. Here is a blog post from another English teacher, Sarah Gross, also found on Edutopia, and it outlines her experience with infographics. If you are interested in exploring the topic further, Kathy Schrock, has a plethora of resources, links, and videos on infographics here.
Infographics in the Google Apps for Education Classroom
Using Google Apps to create infographics only makes that process more dynamic. Students can use many of the different Google Apps to create an infographic. Check out this infographic I created to see how you can use Docs, Slides, Forms, Sheets and, of course, Drawing to compose your original infographic. Google has even provided this Google Docs Infographic Toolbox to help you get started.
First of all, creating your first infographic can seem like an overwhelming task. Leveraging Google Apps collaborative feature allows students to share the load and do the tasks that focus best on their strengths. One student can be the graphic designer, one the researcher, and the other the editor. Furthermore, with the Commenting feature students are able to provide feedback and ask clarifying questions to revise their infographic and make it look their very best. Secondly, using Google Apps makes the project accessible. As long as there is an internet connection, students can access their Drive applications and work anytime and anywhere. Finally, when students use Google Apps to create their infographic it is mistake proof. With the revision history feature changes can be made but if students want to go back to an earlier version of their work, they are able to do so by clicking on the desired version and then choosing “Restore to this version”.
Best Lesson Activities for Infographics
There are many ways you can integrate infographics in your classroom activities, however, there are some that work best. When the learning outcome is to:
- Classify
- Summarize
- Sequence[1]
- Communicate
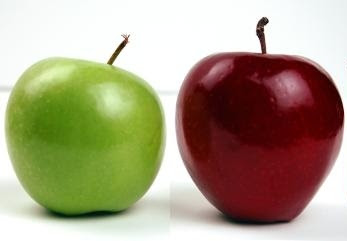
- Compare
- Explain
students can do that by creating an infographic. In fact, by creating some of these kind of infographics you are also incorporating some of Marzano’s High-Yield Instructional Strategies. Maybe you want students to classify the various ecosystems or animal kingdoms. You may want to have students investigate and research a topic and communicate their results using an infographic. In Social Studies classrooms, you may want students to sequence a series of events or compare one era of history to another. There are so many ways you can use infographics in your lessons to have students create and demonstrate their learning. For some sample lesson ideas and infographic templates, click on the titles below.
Math - Geometry (sample)
Math - Geometry Lesson Plan
Science - Cells Lesson Plan
English Language Arts- Making Connections with the Text (template)
English Language Arts- Making Connections Lesson Plan
Social Studies - Immigration Infographic (template)
Social Studies - Immigration Infographic Lesson Plan
AVID College Readiness Class - Job Interviews (sample)
AVID College Readiness Class - Job Interviews Lesson Plan
Planning for Infographic Projects
As with any technology integration project, planning is key. Creating an infographic is a process. We can think of it like the writing process: Planning or Generating Ideas, Drafting, Revising, Editing, and, finally, Publishing. Similarly, when it comes to creating an infographic students must put ideas together first and then sketch a draft of the infographic. The dynamic part of using the revising step with Google Apps is that students can make edits, revisions, comments to make it a truly collaborative, quality project. Furthermore, if you want to publish student work you can publish them on a Google Sites page to share with their parents, their peers, or the world. Since you may be sharing them with the world, you want to make sure students have clear guidance and expectations for the task.
Infographic Tips & Tricks
These are a few tips and tricks for creating infographics with your students.
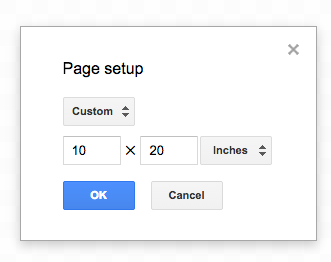
- Setup your page size to 10 x 20
- Establish a theme with design/colors/layout
- Use a maximum of 4 colors
- Have a draft/sketch before creating a Drawing
- If students are collaborating, assign roles so each student does their part.
- Share finished infographics!
Have a Googley Good Time Making Your Infographics!
Creating Infographics with Google Drawing (Step-by-Step)
- Setup your page for your infographic by clicking on File>Page Setup.
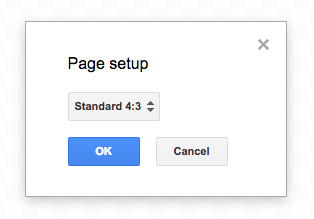
2. The standard page setup is 4:3 but I usually go with a Custom size of 10x20.
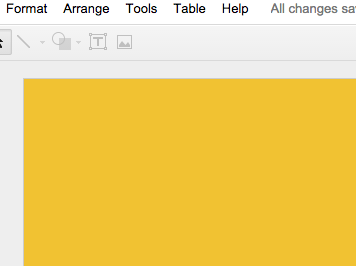
3. After you have setup your page, you will want to give your background a color. When you first look at your page, it has gray and white squares and this means that the background is currently transparent. You can change the color of your background by right-clicking and choosing background or you can draw a rectangular shape to cover the page. I usually go with the right-click option.
4. Once you have your color chosen, you can now create a header or banner. You will use your shapes tool to create your banner. There are a number of shapes to choose from. I like the callouts option under shapes and will choose one of the banners. You will then get an arrow to use as your guide while you draw the shape the size and location you want.
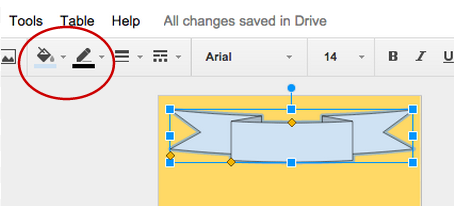
5. The color of the shape is automatically a hideous light blue fill color and a black line color. You will change those using the paint can drop-down menu and the pencil (line color) drop-down menu (see circled icons above). Then to add text to your header by clicking on the Text Box icon.
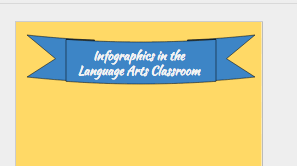

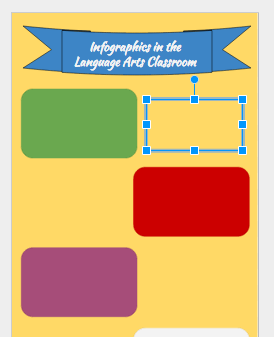
6. Now you are ready to add more shapes, images, and text.
Recently, I learned about a great website for finding free“icons” that are great for infographics called www.flaticon.com I used that site to create the finished infographic.
Use the hyperlink tool to make your infographics more interactive and dynamic.
Icons are found on: www.flaticon.com