
Airlines could be running out of fuel - $JETS
Since it’s launch on May 2015, the U.S Global Jets ETF (JETS) had pretty volatile times.
The ETF’s holdings include companies like Delta Airlines ($DAL) , American Airlines ($AAL) and more american companies from the industry:
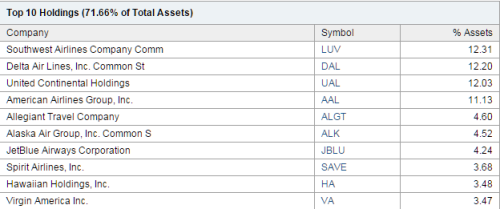
*taken from yahoo finance
During July, as oil prices fell after hitting the monthly 200 SMA line, $JETS experienced a nice rally that pushed its price towards the 25$ zone, very close to setting a new record high:
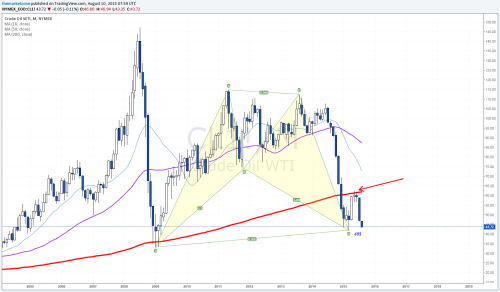
*Oil prices fell after hitting the monthly 200 SMA line
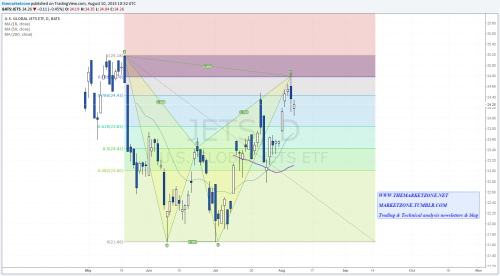
* $JETS July’s rally pushed it all the way to complete a bearish pattern
But..As you can see in $JETS chart above, July’s rally that has pushed the price from 21.5$ to 24.5$ (about 15% in a month) reached up to the 88.6 Fib level and formed a bearish Bat pattern that managed to stop the rally and revert price direction.
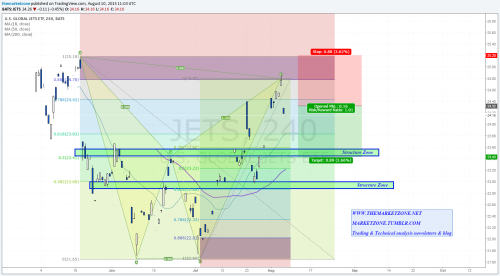
If this daily bearish harmonic pattern will play out, it could drive the price back to one of the daily support zones shown below:
taking a second look at crude oil chart above, will show you that it could be setting up towards another rally with a double bottom inside the monthly Bat’s PRZ (see my TradingView post) and if that will be the case and oil prices are what drove $JETS higher, than a rally in oil prices could do just the opposite and work in favor of this bearish harmonic pattern play in $JETS
23.5$ and 23$ are the pattern’s target levels and current price level offers about 1 R/R ratio for this bearish reversal speculation
So what do you think? Are $JETS, $DAL, $LUV, $AAL heading for a correction?
Share your thoughts with me..

Notes