
The following correction was printed in the Guardian's Corrections and clarifications column, Tuesday 15 June 2010
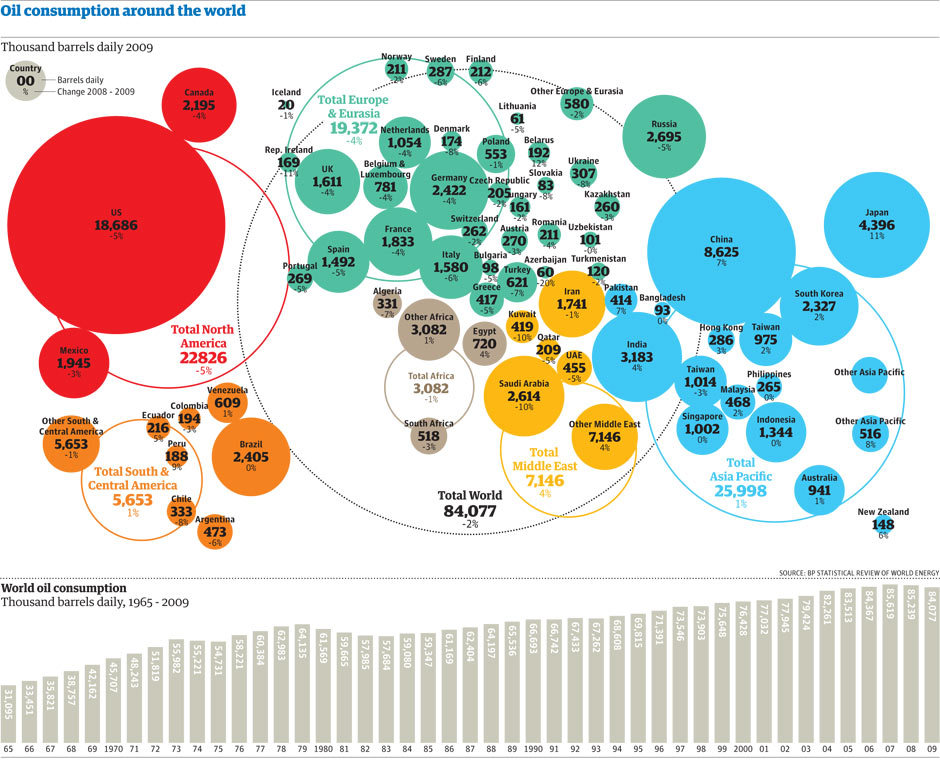
The graphic pictured above gave a global breakdown of how much petroleum is used by countries, regions and continents. The total for Africa should have been 4,651,000 barrels a day, and for the Middle East, 12,584,000 barrels a day.
BP may be struggling to manage the Deepwater Horizon oil spill but its publication of key energy data goes on. The latest figures from BP's annual Statistical Review of World Energy show that world oil consumption fell by 1.2m barrels per day (bpd) in 2009, the second consecutive annual decline and the largest volume since 1982.
Other key findings are:
Oil reserves mapped by Many Eyes - click on image to interact or download• The world's oil production dropped by 2m bpd, or 2.6% - also the largest decline since 1982
• Global oil refining capacity additions totalled 2m bpd, with the Asia-Pacific region accounting for 80% of the increase
• Proven oil reserves stood at 1.33 trillion barrels last year, an increase of 700,000m barrels from 2008
• Gas reserves grew by 2.21tn cubic metres last year, while production fell by 2.1%, marking the first decline on record
You can download the full and complete spreadsheet of data direct from BP - it's an amazing insight to the world's consumption and production of energy.
We've extracted a few of the key tables for you and added in ISO country codes so you can start to play with them.
What can you do with the data?
Download the data
• DATA: download the full datasheet
• Download the full spreadsheet from BP
World government data
• Search the world's government data with our gateway
Can you do something with this data?
Flickr Please post your visualisations and mash-ups on our Flickr group or mail us at datastore@guardian.co.uk
• Get the A-Z of data
• More at the Datastore directory
• Follow us on Twitter
Data summary
|
Order
|
Country
|
2,009
|
Change, 2008-2009
|
2009, % share of total
|
|---|---|---|---|---|
|
SOURCE: BP |
||||
| 1 | US | 18,686 | -4.9% | 21.7% |
| 2 | Canada | 2,195 | -4.4% | 2.5% |
| 3 | Mexico | 1,945 | -3.4% | 2.2% |
| 4 | Total North America | 22,826 | -4.7% | 26.4% |
| 5 | Argentina | 473 | -5.7% | 0.6% |
| 6 | Brazil | 2,405 | -0.2% | 2.7% |
| 7 | Chile | 333 | -7.5% | 0.4% |
| 8 | Colombia | 194 | -2.7% | 0.2% |
| 9 | Ecuador | 216 | 5.2% | 0.3% |
| 10 | Peru | 188 | 8.8% | 0.2% |
| 11 | Venezuela | 609 | 0.9% | 0.7% |
| 12 | Other S. & Cent. America | 1,235 | -0.8% | 1.5% |
| 13 | Total S. & Cent. America | 5,653 | -0.8% | 6.6% |
| 14 | Austria | 270 | -3.2% | 0.3% |
| 15 | Azerbaijan | 60 | -20.2% | 0.1% |
| 16 | Belarus | 192 | 11.6% | 0.2% |
| 17 | Belgium & Luxembourg | 781 | -3.7% | 1.0% |
| 18 | Bulgaria | 98 | -5.2% | 0.1% |
| 19 | Czech Republic | 205 | -2.1% | 0.2% |
| 20 | Denmark | 174 | -8.3% | 0.2% |
| 21 | Finland | 212 | -5.9% | 0.3% |
| 22 | France | 1,833 | -3.5% | 2.3% |
| 23 | Germany | 2,422 | -4.0% | 2.9% |
| 24 | Greece | 417 | -5.3% | 0.5% |
| 25 | Hungary | 161 | -1.9% | 0.2% |
| 26 | Iceland | 20 | 1.2% | w |
| 27 | Republic of Ireland | 169 | -10.6% | 0.2% |
| 28 | Italy | 1,580 | -6.3% | 1.9% |
| 29 | Kazakhstan | 260 | -3.3% | 0.3% |
| 30 | Lithuania | 61 | -4.5% | 0.1% |
| 31 | Netherlands | 1,054 | -3.6% | 1.3% |
| 32 | Norway | 211 | -1.6% | 0.3% |
| 33 | Poland | 553 | 1.2% | 0.7% |
| 34 | Portugal | 269 | -4.8% | 0.3% |
| 35 | Romania | 211 | -4.2% | 0.3% |
| 36 | Russian Federation | 2,695 | -4.8% | 3.2% |
| 37 | Slovakia | 83 | -8.3% | 0.1% |
| 38 | Spain | 1,492 | -5.2% | 1.9% |
| 39 | Sweden | 287 | -5.7% | 0.4% |
| 40 | Switzerland | 262 | 1.9% | 0.3% |
| 41 | Turkey | 621 | -6.5% | 0.7% |
| 42 | Turkmenistan | 120 | 1.6% | 0.1% |
| 43 | Ukraine | 307 | -8.1% | 0.4% |
| 44 | United Kingdom | 1,611 | -4.3% | 1.9% |
| 45 | Uzbekistan | 101 | -0.1% | 0.1% |
| 46 | Other Europe & Eurasia | 580 | -2.0% | 0.7% |
| 47 | Total Europe & Eurasia | 19,372 | -4.2% | 23.5% |
| 48 | Iran | 1,741 | -1.3% | 2.2% |
| 49 | Kuwait | 419 | 9.8% | 0.5% |
| 50 | Qatar | 209 | 5.0% | 0.2% |
| 51 | Saudi Arabia | 2,614 | 9.8% | 3.1% |
| 52 | United Arab Emirates | 455 | -5.0% | 0.6% |
| 53 | Other Middle East | 1,708 | 2.1% | 2.1% |
| 54 | Total Middle East | 7,146 | 3.8% | 8.7% |
| 55 | Algeria | 331 | 6.5% | 0.4% |
| 56 | Egypt | 720 | 3.6% | 0.9% |
| 57 | South Africa | 518 | -2.9% | 0.6% |
| 58 | Other Africa | 1,513 | 0.3% | 1.8% |
| 59 | Total Africa | 3,082 | 1.1% | 3.7% |
| 60 | Australia | 941 | 0.8% | 1.1% |
| 61 | Bangladesh | 93 | 0.4% | 0.1% |
| 62 | China | 8,625 | 6.7% | 10.4% |
| 63 | China Hong Kong SAR | 286 | -2.9% | 0.4% |
| 64 | India | 3,183 | 3.7% | 3.8% |
| 65 | Indonesia | 1,344 | 0.4% | 1.6% |
| 66 | Japan | 4,396 | -10.7% | 5.1% |
| 67 | Malaysia | 468 | -1.6% | 0.6% |
| 68 | New Zealand | 148 | -5.6% | 0.2% |
| 69 | Pakistan | 414 | 7.1% | 0.5% |
| 70 | Philippines | 265 | -0.3% | 0.3% |
| 71 | Singapore | 1,002 | 3.5% | 1.3% |
| 72 | South Korea | 2,327 | 1.5% | 2.7% |
| 73 | Taiwan | 1,014 | -3.3% | 1.2% |
| 74 | Thailand | 975 | 1.7% | 1.1% |
| 75 | Other Asia Pacific | 516 | 8.3% | 0.6% |
| 76 | Total Asia Pacific | 25,998 | 1.0% | 31.1% |
| 77 | Total World | 84,077 | -1.7% | 100.0% |
| 78 | of which: European Union # | 14,143 | -4.4% | 17.3% |
| 79 | OECD | 45,327 | -4.8% | 53.4% |
| 80 | Former Soviet Union | 3,965 | -4.0% | 4.7% |
| 81 | Other EMEs | 34,785 | 2.8% | 41.9% |
|
Order
|
Country
|
2008
|
2009
|
Change, 2008 to 2009
|
SHARE OF TOTAL, 2009
|
% change 2000-09
|
|---|---|---|---|---|---|---|
|
SOURCE: BP |
||||||
| 1 | US | 28.4 | 28.4 | - | 0.02 | -6.5 |
| 2 | Canada | 33.2 | 33.2 | - | 0.02 | 81.4 |
| 3 | Mexico | 11.9 | 11.7 | -0.02 | 0.01 | -42.0 |
| 4 | Total North America | 73.4 | 73.3 | -0 | 0.06 | 6.4 |
| 5 | Argentina | 2.5 | 2.5 | - | 0 | -15.9 |
| 6 | Brazil | 12.8 | 12.9 | 0 | 0.01 | 52.4 |
| 7 | Colombia | 1.4 | 1.4 | -0 | 0 | -29.0 |
| 8 | Ecuador | 6.5 | 6.5 | w | 0 | 42.4 |
| 9 | Peru | 1.1 | 1.1 | - | 0 | 21.5 |
| 10 | Trinidad & Tobago | 0.8 | 0.8 | - | 0 | -6.0 |
| 11 | Venezuela | 172.3 | 172.3 | - | 0.13 | 124.2 |
| 12 | Other S. & Cent. America | 1.4 | 1.4 | w | 0 | 5.5 |
| 13 | Total S. & Cent. America | 198.9 | 198.9 | w | 0.15 | 103.1 |
| 14 | Azerbaijan | 7 | 7 | - | 0 | 494.2 |
| 15 | Denmark | 0.8 | 0.9 | 0.13 | 0 | -19.2 |
| 16 | Italy | 1 | 0.9 | -0.04 | 0 | 5.2 |
| 17 | Kazakhstan | 39.8 | 39.8 | - | 0.03 | 59.1 |
| 18 | Norway | 7.5 | 7.1 | -0.06 | 0 | -37.6 |
| 19 | Romania | 0.5 | 0.5 | - | w | -57.3 |
| 20 | Russian Federation | 74.3 | 74.2 | -0 | 0.06 | 24.4 |
| 21 | Turkmenistan | 0.6 | 0.6 | - | w | 9.9 |
| 22 | United Kingdom | 3.1 | 3.1 | - | 0 | -34.4 |
| 23 | Uzbekistan | 0.6 | 0.6 | - | w | 1.0 |
| 24 | Other Europe & Eurasia | 2.1 | 2.2 | 0.03 | 0 | -5.2 |
| 25 | Total Europe & Eurasia | 137.2 | 136.9 | -0 | 0.1 | 26.1 |
| 26 | Iran | 137.6 | 137.6 | - | 0.1 | 38.2 |
| 27 | Iraq | 115 | 115 | - | 0.09 | 2.2 |
| 28 | Kuwait | 101.5 | 101.5 | - | 0.08 | 5.2 |
| 29 | Oman | 5.6 | 5.6 | - | 0 | -4.2 |
| 30 | Qatar | 26.8 | 26.8 | - | 0.02 | 104.5 |
| 31 | Saudi Arabia | 264.1 | 264.6 | 0 | 0.2 | 0.7 |
| 32 | Syria | 2.5 | 2.5 | - | 0 | 7.5 |
| 33 | United Arab Emirates | 97.8 | 97.8 | - | 0.07 | 0.0 |
| 34 | Yemen | 2.7 | 2.7 | - | 0 | 12.5 |
| 35 | Other Middle East | 0.1 | 0.1 | - | w | -34.6 |
| 36 | Total Middle East | 753.7 | 754.2 | 0 | 0.57 | 8.8 |
| 37 | Algeria | 12.2 | 12.2 | - | 0.01 | 7.8 |
| 38 | Angola | 13.5 | 13.5 | - | 0.01 | 126.1 |
| 39 | Chad | 0.9 | 0.9 | - | 0 | 0.0 |
| 40 | Rep. of Congo (Brazzaville) | 1.9 | 1.9 | - | 0 | 15.2 |
| 41 | Egypt | 4.2 | 4.4 | 0.05 | 0 | 21.3 |
| 42 | Equatorial Guinea | 1.7 | 1.7 | - | 0 | 112.5 |
| 43 | Gabon | 3.7 | 3.7 | - | 0 | 52.9 |
| 44 | Libya | 44.3 | 44.3 | - | 0.03 | 23.1 |
| 45 | Nigeria | 37.2 | 37.2 | - | 0.03 | 28.3 |
| 46 | Sudan | 6.7 | 6.7 | - | 0 | 1016.7 |
| 47 | Tunisia | 0.6 | 0.6 | - | w | 41.1 |
| 48 | Other Africa | 0.6 | 0.6 | - | w | -11.5 |
| 49 | Total Africa | 127.5 | 127.7 | 0 | 0.1 | 36.7 |
| 50 | Australia | 4.2 | 4.2 | 0.01 | 0 | -15.1 |
| 51 | Brunei | 1.1 | 1.1 | - | 0 | -10.6 |
| 52 | China | 14.8 | 14.8 | 0 | 0.01 | -17.5 |
| 53 | India | 5.8 | 5.8 | 0 | 0 | 9.6 |
| 54 | Indonesia | 3.7 | 4.4 | 0.18 | 0 | -14.1 |
| 55 | Malaysia | 5.5 | 5.5 | - | 0 | 21.4 |
| 56 | Thailand | 0.5 | 0.5 | - | w | -2.9 |
| 57 | Vietnam | 4.7 | 4.5 | -0.05 | 0 | 130.8 |
| 58 | Other Asia Pacific | 1.4 | 1.3 | -0.03 | 0 | -2.6 |
| 59 | Total Asia Pacific | 41.7 | 42.2 | 0.01 | 0.03 | -1.5 |
| 60 | Total World | 1332.4 | 1333.1 | 0 | 1 | 20.7 |
| 61 | European Union | 6.1 | 6.3 | 0.02 | 0 | -28.7 |
| 62 | OECD | 91.3 | 90.8 | -0 | 0.07 | -2.7 |
| 63 | OPEC | 1028.8 | 1029.4 | 0 | 0.77 | 21.0 |
| 64 | Non-OPEC £ | 180.6 | 180.9 | 0 | 0.14 | 9.1 |
| 65 | Former Soviet Union | 123 | 122.9 | -0 | 0.09 | 40.2 |
| 66 | Canadian oil sands | 143.3 | 143.3 | |||
| 67 | Proved reserves and oil sands | 1475.7 | 1476.4 | |||
