Higher education funding was down 35%
Grantmaking was down 20% in 2012, which was mostly due to a $21 million decline in support for higher education and $13.5 million decline in support for human services. The James F. and Marion L. Miller Foundation had the greatest impact on the education numbers: in 2010 it granted $27 million to colleges and universities, but discontinued funding commitments to higher education in 2012. several one-time capital grants to youth development in 2010 totaling $16 million drove the decrease in human services funding. Despite this overall decline, several funders increased their grantmaking in 2012. The Maybelle Clark MacDonald Fund increased its giving by 216% ($11 million) and M.J. Murdock Charitable Trust by 34% ($3 million). The environmental/animal-related sector was the only one to experience an increase in funding—17% ($2.6 million). Most of these gains benefited environmental and animal-related advocacy, policy analysis, education and support services.
 Total giving by 101 organizations: $202,912,819
Median grant: $5,850
Number of grants: 7,139
Change in giving from 2010: -20%
Top 10 Grantmakers to Oregon, 2012
- The Oregon Community Foundation (OR)
- Meyer Memorial Trust (OR)
- Ann and Bill Swindells Charitable Trust (OR)
- Maybelle Clark MacDonald Fund (OR)
- M. J. Murdock Charitable Trust (WA)
- The Ford Family Foundation (OR)
- Bill & Melinda Gates Foundation (WA)
- The Collins Foundation (OR)
- Intel Corporation (OR)
- National Fish & Wildlife Foundation (DC)
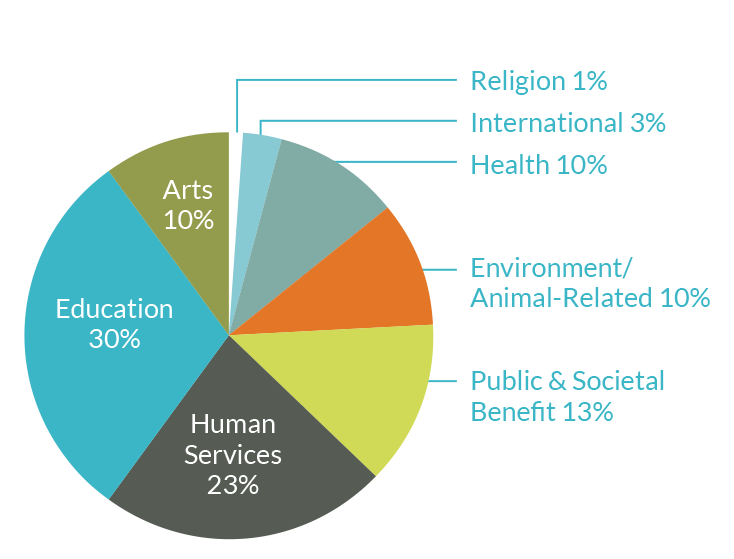
Giving to Oregon by Subject Area & Subcategory
| Subject & Subcategory | Total Grants | % of Subject Area & Total |
| Arts | $ 20,749,865 | 10.23% |
| Arts & Culture | $ 1,257,301 | 6.06% |
| Arts Education | $ 1,684,077 | 8.12% |
| Arts Support & Services | $ 105,790 | 0.51% |
| Historical Societies & Historical Preservation | $ 946,203 | 4.56% |
| Humanities | $ 432,505 | 2.08% |
| Media & Communications | $ 1,525,438 | 7.35% |
| Museums | $ 4,947,415 | 23.84% |
| Performing Arts | $ 9,267,257 | 44.66% |
| Visual Arts | $ 583,879 | 2.81% |
| Education | $ 60,937,644 | 30.03% |
| Adult Education | $ 433,919 | 0.71% |
| Alliances, Advocacy & Policy Analysis | $ 4,335,832 | 7.12% |
| Colleges & Universities, Graduate & Professional Schools | $ 41,270,700 | 67.73% |
| Early Childhood Education | $ 2,034,604 | 3.34% |
| Education Support & Services | $ 2,576,081 | 4.23% |
| Elementary & Secondary Schools | $ 7,763,001 | 12.74% |
| Libraries | $ 831,600 | 1.36% |
| Special Education | $ 150,652 | 0.25% |
| Two-Year Colleges, Vocational & Technical Schools | $ 1,541,255 | 2.53% |
| Environment/Animal-Related | $ 19,977,247 | 9.84% |
| Alliances, Advocacy & Policy Analysis | $ 1,936,323 | 9.69% |
| Animal Protection & Welfare | $ 290,381 | 1.45% |
| Botanical Gardens, Arboreta, Horticulture | $ 1,330,646 | 6.66% |
| Climate Change | $ 725,616 | 3.63% |
| Environment & Animal Support | $ 1,078,759 | 5.40% |
| Environmental Education | $ 948,452 | 4.75% |
| Pollution Abatement & Control, Recycling | $ 416,666 | 2.09% |
| Sustainable Urban or Rural Economic Development | $ 1,864,042 | 9.33% |
| Wildlife & Natural Resource Protection & Conservation | $ 11,166,329 | 55.90% |
| Zoos & Aquariums | $ 220,033 | 1.10% |
| Health | $ 20,900,444 | 10.30% |
| Ambulatory & Primary Health Care | $ 4,563,559 | 21.83% |
| Cancer Treatment, Support & Research | $ 414,151 | 1.98% |
| General Health Support & Financing | $ 570,556 | 2.73% |
| Hospitals & Health Systems | $ 4,753,677 | 22.74% |
| Medical Research | $ 44,800 | 0.21% |
| Mental Health & Crisis Intervention | $ 6,968,955 | 33.34% |
| Nursing | $ 20,245 | 0.10% |
| Public Health | $ 2,147,776 | 10.28% |
| Rehabilitative Care | $ 196,290 | 0.94% |
| Reproductive Health Care | $ 132,215 | 0.63% |
| Specific Diseases (Treatment & Prevention) | $ 1,088,220 | 5.21% |
| Human Services | $ 46,458,184 | 22.89% |
| Centers | $ 2,061,222 | 4.44% |
| Children & Youth Services | $ 5,954,774 | 12.82% |
| Crime, Justice & Legal Services | $ 3,298,724 | 7.10% |
| Emergency Assistance | $ 589,787 | 1.27% |
| Employment/Jobs | $ 1,895,355 | 4.08% |
| Family Services | $ 4,474,169 | 9.63% |
| Food, Agriculture & Nutrition | $ 4,307,138 | 9.27% |
| Housing & Shelter | $ 2,972,058 | 6.40% |
| Human Services Support | $ 592,725 | 1.28% |
| Multipurpose | $ 7,521,633 | 16.19% |
| Personal Social Services | $ 563,062 | 1.21% |
| Public Safety, Disaster Preparedness & Relief | $ 598,175 | 1.29% |
| Recreation & Sports | $ 2,503,815 | 5.39% |
| Residential Care & Adult Day Programs | $ 377,958 | 0.81% |
| Youth Development | $ 8,747,589 | 18.83% |
| International | $ 5,336,218 | 2.63% |
| Foreign Affairs & National Security | $ 109,500 | 2.05% |
| Human Rights | $ 1,500 | 0.03% |
| International Development | $ 4,468,824 | 83.75% |
| International Health | $ 596,021 | 11.17% |
| International Relief | $ 110,844 | 2.08% |
| International, Foreign Affairs & National Security | $ 20,000 | 0.37% |
| Promotion of International Understanding | $ 29,530 | 0.55% |
| Public & Societal Benefit | $ 25,340,812 | 12.49% |
| Alliances, Advocacy & Policy Analysis | $ 20,000 | 0.08% |
| Civil Rights, Social Action & Advocacy | $ 1,114,978 | 4.40% |
| Community Improvement & Capacity Building | $ 2,062,723 | 8.14% |
| Economic Development | $ 6,370,146 | 25.14% |
| Financial Institutions | $ 71,000 | 0.28% |
| Government & Public Administration | $ 1,683,056 | 6.64% |
| Leadership Development | $ 127,330 | 0.50% |
| Military & Veterans Organizations | $ 149,385 | 0.59% |
| Nonprofit Management | $ 1,232,565 | 4.86% |
| Philanthropy, Voluntarism & Grantmaking Foundations | $ 10,644,408 | 42.01% |
| Public & Societal Benefit | $ 95,365 | 0.38% |
| Public Policy Research | $ 538,000 | 2.12% |
| Science & Technology | $ 164,925 | 0.65% |
| Social Science | $ 304,151 | 1.20% |
| Voter Education | $ 762,780 | 3.01% |
| Religion | $ 3,012,279 | 1.48% |
| Buddhism | $ 8,901 | 0.30% |
| Christianity | $ 2,795,814 | 92.81% |
| Hinduism | $ 3,730 | 0.12% |
| Interfaith Coalitions | $ 57,168 | 1.90% |
| Islam | $ 7,510 | 0.25% |
| Judaism | $ 139,156 | 4.62% |
| Unknown | $ 209,125 | 0.10% |
| Unknown | $ 209,125 | |
| Total | $ 202,921,818 |