Showing posts with label Creating Variables Series. Show all posts

Wednesday, October 10, 2012

Creating Variables: Fiscal Year


                For those of you whose fiscal year is different from the calendar year, having a Fiscal Year variable can be a huge timesaver, which is why we've chosen it as the next entry in our Creating Variables series. Filtering and sorting on this variable make it easy to compare things like gifts on a fiscal year to fiscal year basis, as well as easily focus on one or more years of interest. Fortunately, creating this variable is easy by following these steps in Veera:

The first step is to hook your dataset to a transform node:


Once in the transform, select the date variable (in the form DD/MM/YY) you’d like to extract fiscal year from. Next, click on the “IF” button (the top button on the right-hand side) to generate an ‘if’ equation. In the Enter A Formula window, we’ll want to edit the auto-generated equation so it reads:

IF(month(A)>=7,year(A)+1,year(A))

where A is the date field that you’re extracting fiscal year from. This example is assuming a July 1 fiscal year start, which is why we used the number 7 (feel free to edit accordingly). Be sure to name the new variable and select “text” from the Result Type list before saving.


The formula is saying that if the month of the date field falls after the beginning of the new fiscal year, then set the fiscal year to the newer fiscal year (which is the year after A because the fiscal year will end in that next year). Otherwise, we’re setting the fiscal year equal to the year of the date field (because the fiscal year ends in that year).

Finito!

-Caitlin Garrett, Statistical Analyst at Rapid Insight

Friday, June 8, 2012

Creating Variables: Retention and Attrition

Now that we’ve highlighted some basic variables in our Creating Variables series, I think we’re ready to move on to a variable that is a little trickier to create: retention. The retention variable we’ll create will represent whether or not a freshman is retained from one fall semester to the next. Because of the number of different factors you can choose to include or exclude, I hope that you’ll use these instructions as a general guide rather than a hard-and-fast manual on how to create a retention variable.

In order to create a fall-to-fall retention variable, we need to be looking at enrollment data from several consecutive fall semesters. In order to focus just on freshmen, we’ll start by placing a filter on our first semester:


Within the filter, you’ll want to focus on the field in your dataset that represents student year and filter down to just those students who are freshmen. If you’d like to include other filters here, such as making sure you’re focusing on first-time freshmen rather than transfer students, or undergraduate rather than graduate students, this is the time to do so.
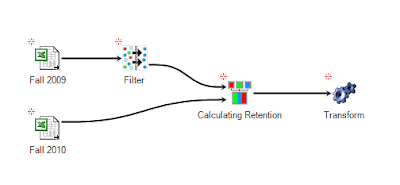
The next step is to merge this dataset and filter with the next consecutive fall semester:


Inside the merge, you’ll want to connect the datasets on an identifying field, such as student ID. In doing so, you’ll want to take all of the information about each student from only the first column, so your merge should look something like this:


Here’s where the magic happens. After you’ve set up the merge, you need to do one more step before 
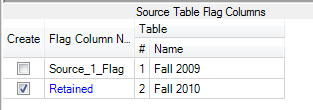
exiting the merge node. See the section titled “Source Table Flag Columns” in the bottom right corner? That’s where we’re headed. This section allows you to create a flag variable that tells you which dataset your information came from. In this case, we’ll create a flag to let us know whenever a student shows up in both datasets and we’ll call this variable “Retained” (double click on the existing name to rename it). It should look something like this:


Now we’re getting close, but we’re not done yet: those of you who have done some predictive modeling probably know that usually when we talk about retention, we’re actually planning to model attrition. (So, instead of modeling each student’s likelihood of leaving, we’d model each student’s likelihood of staying.)Modeling attrition rather than retention is helpful because we’re focusing on a smaller population of students and honing in on the characteristics of students who are likely to leave more directly. To accomplish this, we’ll need to add a transform in order to create a new attrition variable.


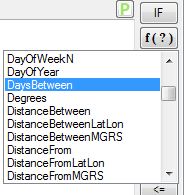
In the transform, we’re going to set up the attrition variable to be the opposite of the “retained” variable. To do this, we’ll want to select the “retained” variable to work with and type the following into the Enter a Formula window: IF (A=1, 0, 1). This basically turns zeros to ones and ones to zeros. Set the result type to binary and be sure to name the variable something like “attrition” before creating and exiting… And there you have it, a state-of-the-art attrition variable to add to your collection!

-Caitlin Garrett, Statistical Analyst at Rapid Insight

Tuesday, April 17, 2012

Creating Variables: Out-of-state Flag


Sometimes it’s good to see which of your students or donors are in-state because an in-state population may be more likely to enroll or be retained or give than an out-of-state population. Creating an out-of-state flag from a “state” variable allows you to easily differentiate between your in-state and out-of-state prospects. I should also note that it is just as easy to create an in-state flag if that better suits your data. In any case, here’s how:

The first step is to hook your data source to a transform node:

Because we’ll be creating a binary (“yes or no”) variable, we’ll want to click on the “if” button (at the top of the buttons on the right side), which will automatically generate an equation that we can change to suit our data. 

In the “Enter a Formula” window, we’ll want to edit the auto-generated equation so it reads:


Where ‘[A]’ is the variable in our dataset that represents state, and the term it is set equal to (in this case, ‘NH’) is the term in our dataset that represents our institution’s state. Note that we could have set state equal to ‘New Hampshire’ or a numerical code, as long as it matches the term that represents New Hampshire in our dataset. The equation outputs a variable that is equal to ‘1’ when state is NOT New Hampshire and ‘0’ otherwise, thus flagging records which are out-of-state.


The final step before naming and saving your out-of-state flag is to select “binary” from the “Result Type” list.


And, voila, it’s easy as that! You now have a quick way of identifying in-state vs. out-of-state students in your dataset; let the reporting begin!

PS: If you guys have any specific requests for a variable to be featured in the "Creating Variables" series, please leave them in the comments or email me directly!

-Caitlin Garrett, Statistical Analyst at Rapid Insight

Wednesday, April 4, 2012

Creating Variables: Age


Hi all! Today I’d like to a cover a pretty universally predictive variable: age. Age can be created in relation to the date of a particular event (like an application date or a mailing date), or as a reflection of age today, at this moment. Either way, age is often predictive and easy to add to your dataset by creating it in Veera from a “birth date” field.

The first step in doing so is to hook your data source to a transform node: 
After opening the transform node, we’ll want to click on the function button and select the second “YearsBetween” function.

[Note: Veera is capable of outputting the number of years between two dates in two separate ways. The first function on the list calculates the number of years between two dates, regardless of the actual day and month, while the second function calculates the number of years between two dates taking day and month into account. To illustrate this point, take the dates December 1, 1960, and April 1, 1980. Using the first “YearsBetween” function, the number of years between these dates is 20. Using the second “Years Between” function, the number of years between these dates is 19. See the difference?]

Here, we have two options. We can (a) calculate age today or (b) calculate age at a specific point in time, depending on what we type in the “Enter a Formula” window.

(a) Age today:  


Where ‘[A]’ corresponds to the variable in your dataset that represents birthdate, and “TODAY()” is the Today function from the drop-down menu on the right. 


or


(b) Age at a specific point in time:


Where ‘[A]’ corresponds to the variable in your dataset the represents birthdate, and ‘00/00/0000’ represents the specific date on which you’d like to measure age. 

Be sure to save before exiting the transform node, and there you have it, a brand-new age variable!

PS: If you guys have any specific requests for a variable to be featured in the "creating variables" series, please leave them in the comments or email me directly!

-Caitlin Garrett, Statistical Analyst at Rapid Insight


Thursday, March 8, 2012

Creating Variables: Days Between Application Date and Term Start


Hello everybody! This post will be a continuation of the Creating Variables series. Today we’ll be discussing how and why to create a “days between application date and term start” variable.

At first glance, this variable seems a little long-winded, but I can assure you, it’s worth its weight in characters. As you all know, for any institution that accepts applications on a non-rolling basis, there exists a window of time during which applications must be filed to be considered for acceptance. The amount of time between when an application is submitted and when the relevant admission term begins can be an indication of a student’s interest in a particular institution. For example, a student may turn in an application to his first-choice college during the first week that applications are accepted, but this same student might wait until the day or week before the deadline to turn in applications to his safety or back-up schools. In this way, the amount of time between the day that a student turns in an application and the term start date can be seen as an indicator of that student’s interest. Let’s go ahead and calculate this:

The first step is to hook applicant data into a transform node:


Next, after opening the transform node, we’ll need to select the “Days Between” formula from the drop-down menu:


In the “Enter a Formula” window, we’ll want to enter:


…Where ‘[A]’ corresponds to the variable in your dataset that represents the date each application was submitted, ‘09/01/2012’ represents the start date for the term you’re admitting for, and “date” is actually the date function from the formula drop-down menu:


Before naming and saving this new variable, be sure to switch the “Result Type” to “integer”:


And, voila! Now you have a “days between application date and term start variable” to add to your predictive variable arsenal.

-Caitlin Garrett, Statistical Analyst at Rapid Insight

Friday, February 10, 2012

Creating Variables: Distance From Campus


Hi folks. This is the first entry in a new series I'll call "Creating Variables". This series will explain the creation and use of helpful predictive variables that might not be present in your existing datasets.

Today we’ll talk about how to create a “distance from” variable.  A "distance from" variable can also be applied to things like retail sales, fundraising or donor models, or even hospital admissions. This variable is particularly useful for predicting enrollment at admission, which is the example we'll use. Because we don’t have a lot of information about each candidate at admission, we have to use each piece of information we’re given to the best of our ability. In this case, we use the zip code of each applicant and the zip code of our institution to determine each applicant’s distance from campus. Distance from campus is often very predictive of an applicant’s likelihood to enroll at a particular institution – usually, the closer an applicant lives to the institution, the more likely they are to enroll there.  Let’s get started.


 To begin, we’ll need to hook the applicant data into a transform node:


Opening the transform node, we’ll need to select “Distance Between” from the formula drop-down menu:


In the “Enter a Formula” window, you’ll want to enter:


Where “A” is the variable in your dataset that represents each applicant’s zip code, and ‘03818’ is replaced by your institution’s zip code. Be sure to set the result type to “Integer” and name your new variable “Distance from Campus” before saving. If you preview your data, you'll see that each student now has a value in the "Distance from Campus" column, which will be located all the way on the right as you scroll through your admission variables. 

Tada! At this point, you’re ready to output your dataset, augmented with a shiny new variable, and one step closer to predicting enrollment! 

-Caitlin Garrett, Statistical Analyst at Rapid Insight