What is L-Debug
L-Debug is a debug stack for Lasso. It allows you to set up tracers that provide a clear overview of your application logic and methods to quickly determine what, where, and why a problem has occurred.!
What use is it to me?
Have you ever frantically searched for the cause of a bug that's just taken down your client's website? Ever had to randomly comment out large chunks of code desperately trying to work out what is causing what where and why!?
Then L-Debug may be of use to you.
L-Debug will allow you to track down that issue at an instance, simply cast your over eyes over the resulting debug stack; what occurred and where will be immediately apparent. All with minimal effort.
What is it again?
L-Debug is a self contained Lasso type - a debug stack, it's simple to install and easy to use. You can throw objects at it to render, insert markers, time tasks and most importantly capture and locate those illusive errors. It records the sequence of events and once the task has completed outputs them in a clear and searchable interface.
Features
- Complete AJAX support - stack automatically updates stack after each AJAX call.
- Async tag support - see exactly what's gone wrong with those async threads.
- Searchable stack - filters stack based on keyword whilst showing any associated logic.
- On demand availability - leave your tracers in place with virtually zero overhead.
- Supports past and present programming methodologies
- Very easy to use
Installation
- Download the package from www.L-Debug.org/L-Debug.zip
Or check out with Subversion from svn://svn.zeroloop.com/L-Debug/tags/public/stable - Extract the files to a folder within your wwwroot - we'll use /debug to demo
- Ensure the .ctyp extension is enabled in Site Admin > File Extensions > Lasso Page Extensions
Or you can change the extension to what you wish (.inc etc) - Type definition. You have a number of options here, for now let's just include it when we need to.
include:'/debug/debug.ctyp';
If you want to get the most out of L-Debug you will need to install it as a Global type. This can be done by placing the debug.ctyp file in your site start-up folder. Or more conveniently add the following code to the start of your initialise / controller routine.
namespace_using:namespace_global;
include:'/debug/debug.ctyp';
/namespace_using;
L-Debug Usage
As a security precaution L-Debug is disabled by default. When disabled it simply ignores anything it's passed and will not output any results. From here let's assume that L-debug is defined / included on the current Lasso page (or globally).
L-Debug is activated like so:
debug->activate;
To re-emphasise: Without the above you will not see any results. It's also important to note, that you will need to implement your own security logic around activation.
Once activated, you can start to pass data to the debug stack. Note that the L-Debug functions differently to standard Lasso Types — we'll explore that later. To get things rolling:
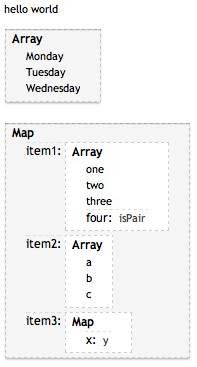
debug:'hello world';
OK, so it's not all that original or useful - but it's a start. Let's stack up a few more complex items;
debug:array('Monday','Tuesday','Wednesday');
Things now start to get a touch more interesting. L-Debug traverses the objects it's passed and renders then accordingly. Let's crank up the complexity:
local:'map' = map;
#map->insert('item1'=array('one','two','three','four'='isPair'));
#map->insert('item2'=array('a','b','c'));
#map->insert('item3'=map('x'='y'));
debug:#map;
L-Debug also copes comfortably complex types — making them much easier to read and brake down logically.
Custom Labels
Objects added to the stack can be given custom labels. This is useful if you want to know exactly what the object you're looking at is. You can label an object by passing L-Debug a pair, the first element is used as the label:
local:'myArray' = array('one','two','three');
debug:'myArray label' = #myArray;
Practical Usage
L-Debug's productivity boost really comes into play when used with OOP (Object Orientated Programing) and to a lesser extent custom tags. It can be used with included and flat files without issue - although you may find it difficult to apply some of the logic from the examples in this document.
We'll start with a basic custom tag — tags are pretty much the smallest units of code within Lasso.
define_tag:'cleanString',-optional='string';
return: #string->replace(' ','');
/define_tag;
cleanString;
The above code will cause a Lasso error on the current page: (-9947) Local variable "string" not found
The error message states what went wrong, but not where. In this example, we know where due to the simplicity - in a full application we would be reaching in the dark.
Using L-Debug we can add few lines to provide some useful feed back about where the error occurred.
define_tag:'cleanString',-optional='string';

handle_error;
debug(tag_name': 'error_msg,-error);
/handle_error;
return: #string->replace(' ','');
/define_tag;
cleanString;
Now we know where the error occurred — simple. To prevent the page from crashing we can suppress the error with Lasso's protect tag. By using L-Debug we will still be able to see the error in the debug stack. Here's how it's done:
define_tag:'cleanString',-optional='string';
protect;
handle_error;
debug(tag_name': 'error_msg,-error);
/handle_error;
return: #string->replace(' ','');
/protect;
/define_tag;
cleanString;
The -error parameter tells L-Debug that the supplied text is an error so it can display it accordingly. When and where you should suppress errors is a whole other topic that won't be covered in this document.
In the example given, the amount of extra debug code may seem extreme when compared to the amount of functional code - in the real world the debug code tends to form a small fraction of the code base.
Nested debug blocks
Our brains tend to cope with information better when it is grouped logically in to manageable chunks. You've already seen how L-Debug groups complex Lasso types into a readable form — we're now going to do the same for a sub routine.
define_tag:'myTask',-optional = 'task';
handle_error;
debug(error_msg,-error);
/handle_error;
debug(tag_name,-open);
handle;debug(-close);/handle;
select:local('task');
case:'delete';
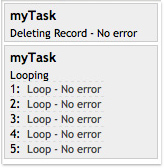
debug:'Deleting Record - 'error_msg;
case:'loop';
debug:'Looping';
loop:5;
debug:loop_count = 'Loop - 'error_msg;
/loop;
/select;
/define_tag;
myTask('delete');
myTask('loop');
So what's changed? Well we've mainly added two new lines:
debug(tag_name,-title,-open);
handle;debug(-close);/handle;
The first tells L-Debug to -open a new debug block with the tag_name as the -title. The second handle and -close line ensures that the block is closed at the end of the current process (the myTask tag). Any debug calls within the myTask tag will now be placed within the current debug block. This greatly improves readability when compared to a typical programming debug stack — single lines of data.
Due to the way that Lasso queues it handle blocks it's important that the -error handler is processed before before the -close handler. This ensures that any error messages are displayed within the current debug block.
Working with Custom Types
As a custom type is predominately a collection of tags, we can use also use the same techniques we use for custom tags with member tags. We can also put Lasso's built in call-back tags to good use:
define_type:'myType';
define_tag:'onCreate';
debug->open(self->type' > 'tag_name);
handle;debug->close;/handle;
self->init;
/define_tag;
define_tag:'init';
debug->open(self->type' > 'tag_name);
handle;debug->close;/handle;
debug('Initialised');
/define_tag;
define_tag:'tagThatBreaks';
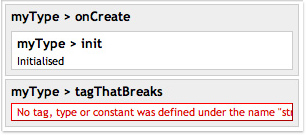
debug->open(self->type' > 'tag_name);
handle;debug->close(-withErrors);/handle;
strng('I don\'t work');
/define_tag;
/define_type;
local('myType') = myType;
#myType->tagThatBreaks;
You may have noticed that we've switched to an OO style of code — see "Syntax Style".
Asynchronous Tag Support
Debugging asynchronous tags normally requires tedious use of the log_critical or log_console tags. With L-Debug we can treat -Async tags is if they where part of the current page and debug stack.
debug->title('Current Thread: 'Thread_GetCurrentID);
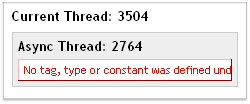
define_tag:'myAsyncTag',-async;
debug = #debug;
debug->open('Async Thread: 'Thread_GetCurrentID);
handle;debug->close(-withErrors,-signal);/handle;
oops;
/define_tag;
myAsyncTag(-debug=debug->async);
We simply pass the -debug stack to the async tag with a special member tag ->async that tag tells the current stack to wait for the async tag to finish. At the start of the async tag we assign the debug stack to the current thread ( debug = #debug; ) and that at the end we -signal that the tag has finished.
No variables or locals?
L-debug works differently to standard ctypes. When it is called, it checks to see if it has been initialised in the current thread. If so, it will switch to the existing debug stack. From a practical perspective it's important that very few dependencies are required for L-Debug to function. For example having to cast it as a variable to use it would also require checking that the variable is defined before calling $debug->open('hello') or similar. By defining L-Debug in the global name space we can be sure that it is always available, keeping the debug code simple and always in place.
After that note, if you should require to work with L-Debug as a local you can do so like so:
local('myDebug') = debug(-asLocal);
#myDebug->this('Hello');
#myDebug->asHTML;
Syntax style
L-Debug supports multiple syntax styles; it does it's best to include everyone. It also allows for a greater flexibility when building or automating debug stacks. Here are some comparisons — all are valid and you can choose the style that suites you best.
debug->open(tag_name); | debug(tag_name,-open); | debug:tag_name,-open; |
debug->close; | debug(-close); | debug:-close; |
debug->sql('SELECT * FROM table') | debug('SELECT * FROM table',-sql) | debug:'SELECT * FROM table',-sql; |
Daisy Chaining
L-Debug supports daisy chaining commands - for example you do do the below without any re-targeting:
debug->open('My Thing')->close;
// Or something more complex
debug->open('My SQL Statement')->sql('SELECT * FROM test')->close;
Timer Stack
L-Debug contains a separate timer stack for overall page timing. It can be access by clicking the total page processing time about the search box. Items can be inserted by using the ->timer tag or -timer parameter:
debug->timer('Done this');
sleep(500);
debug->timer('And this')
Member Tags & Parameters
Below is an outline of the various debugging options that are available. They each serve a different purpose, but generally they alter how the current input is displayed once in the debug stack. Some parameters can be used in conjunction, for example both of these result in "Test" being wrapped in it's own debug block.
debug->open('Test',-close); | debug('Test',-open,-close); |
Here's the full list of public tags:
Member Tag | Param | Description |
->this | 'item to trace' | Same as calling debug('item to trace') |
->open | -open | Opens a new debug block (input set as a -title by default) |
->close | -close | Closes the current debug block |
->error | -error | Sets the current input as an error |
->sql | -sql | Sets the current input as a SQL statement |
->html | -html | Sets the current input as HTML |
->xml | -xml | Sets the current input as XML |
->code | -code | Sets the current input as plain text / code |
->timer | -timer | Insert the current input into the overall timer stack (generally the content is not added to standard stack) |
->time | -time | Inserts either the process time of the current page or if a date_mSec value is supplied the seconds since |
->header | -header | Sets the current input to be a sectionlarge header |
->title | -title | Sets the current input to be a section title |
->async | -async | Returns debug stack triggers a wait state |
->signal | -signal | Sends signal to resume. |
->withErrors | -withErrors | If an error exists it is also inserted into the the stack |
Alternative Modes
L-Debug currently has two alternative modes built into it. Timer mode - automatically times elements in the current stack. And console mode - which logs a plain text output to the Lasso console (using log_critical). A future XML mode is on the cards - this will serialise all objects add to the stack.
debug->activate( -mode = 'timer' ); | debug->activate( -mode = 'console' ); |
Useful Snippets
You'll probably want to save these to use as insert-able templates within your preferred IDE.
debug->open(tag_name); handle;debug->close(-anyError);/handle; | debug:tag_name,-open; handle;debug:-anyError,-close;/handle; |
debug->open(tag_name); debug(params); handle;debug->close(-anyError);/handle; | debug:tag_name,-open; debug:params; handle;debug:-anyError,-close;/handle; |
debug->open(self->type' > 'tag_name); debug(params); handle;debug->close(-anyError);/handle | debug:self->type+' > '+tag_name,-open; debug:params; handle;debug:-anyError,-close;/handle; |
debug->open(self->type' > 'tag_name); local('_start') = date_mSec; handle;debug->close(-anyError,-time=#_start);/handle; | debug:self->type+' > '+tag_name,-open; local:'_start' = date_mSec; handle;debug:-anyError,-close,-time=#_start;/handle; |
The L-Debug Interace
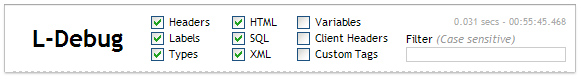
The various check boxes allow you to toggle what is displayed in the debug stack below. The three un-checked boxs (Variables, Client Header & Custom Tags) show each of these values from the current page. The thread processing time, and time including milliseconds is displayed on the right.
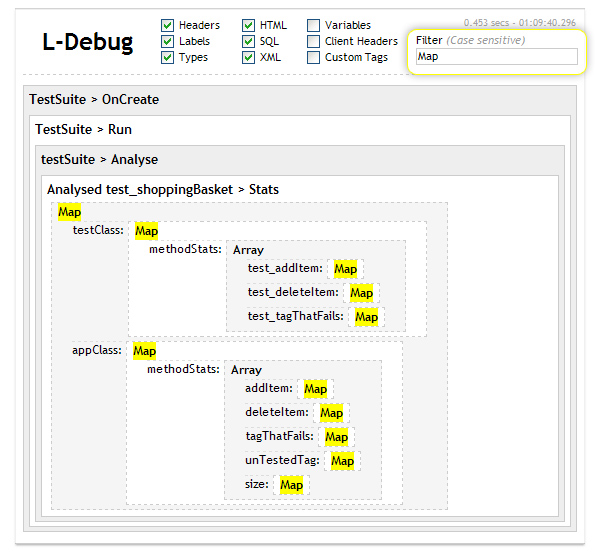
You can also filter your results based on keyword. This allows you to effectively search the debug stack without having to scroll up or down. The below stack is normally 5-6 pages long, here's how it looks filtered:
What's Next?
Give it a go! Hopefully it will save you some time and prove useful in those stressful situations.
If you find any bugs, or have any ideas for improvement or comments then please do share.
© www.L-Debug.org - Ke Carlton 2008 (www.zeroloop.com)