The following is the testimony of David Cooper, EPI senior economic analyst, in a hearing before the New York State Department of Labor Wage Board in Albany, N.Y. on increasing the minimum wage in the fast-food industry on Monday, June 22, 2015.
Mr. Chairman and members of the fast-food wage board, thank you for holding this hearing and allowing me to speak with you today. My name is David Cooper. I am a senior analyst at the Economic Policy Institute (EPI), a nonpartisan, nonprofit research organization in Washington, DC. Since 1986, EPI has conducted research on the economy, with a focus on the economic conditions of workers and low- and middle-income families. Our staff—which includes nine in-house Ph.D. researchers, as well as nearly three dozen Ph.D. research associates throughout the country—regularly analyzes public policies with regard to their effect on the economic conditions of working people and the broader economy. EPI researchers were the first to recognize and illustrate the decoupling of rising labor productivity and worker pay—the issue that is, in many ways, at the heart of why this wage board was convened.
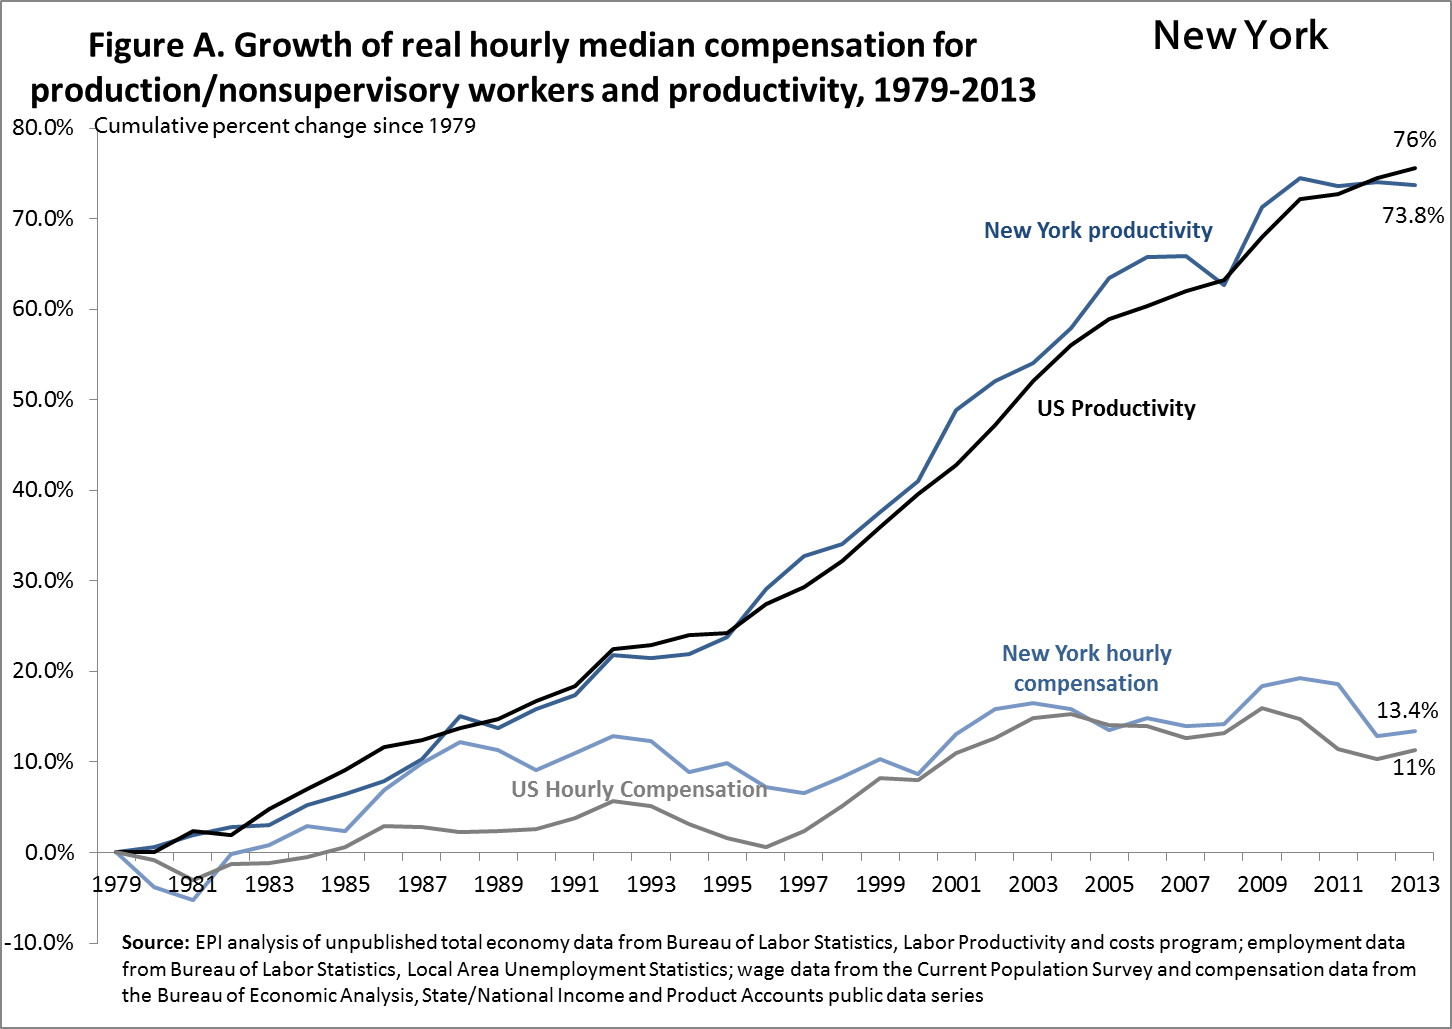
In the three-decade period that followed the end of the Second World War, rising average U.S. labor productivity was accompanied by rising inflation-adjusted hourly wages for workers at all levels of pay. However, beginning in the late 1970s, this relationship broke down. As shown in Figure A, from 1979 to 2013, average U.S. labor productivity increased by 76 percent, yet real median hourly compensation (including benefits such as retirement and healthcare) for nonsupervisory production workers increased by only 11 percent.1 Similarly, in New York State, average productivity rose by roughly 74 percent, yet median hourly compensation for ordinary workers here increased by just over 13 percent.
Hourly wages of all workers in New York State, by wage percentile, 1979-2014 (2014 dollars)
|
Wage by percentile* |
|||||
|---|---|---|---|---|---|
| Year | 10th percentile | 20th percentile | 50th percentile (Median) | 80th percentile | 90th percentile |
| 1979 | $9.16 | $10.67 | $16.74 | $26.17 | $32.63 |
| 1989 | $8.76 | $10.81 | $18.29 | $29.46 | $37.24 |
| 1995 | $8.04 | $10.49 | $17.79 | $29.64 | $39.47 |
| 2000 | $8.54 | $10.72 | $17.90 | $31.26 | $41.27 |
| 2007 | $8.95 | $11.22 | $18.49 | $33.13 | $44.15 |
| 2014 | $8.82 | $10.52 | $18.79 | $34.18 | $46.17 |
| Cumulative percentage change | |||||
| 1979–1995 | -12.2% | -1.7% | 6.3% | 13.3% | 21.0% |
| 1995–2000 | 6.2% | 2.2% | 0.6% | 5.5% | 4.6% |
| 2000–2007 | 4.8% | 4.7% | 3.3% | 6.0% | 7.0% |
| 2007–2014 | -1.5% | -6.2% | 1.6% | 3.2% | 4.6% |
| 1979–2014 | -3.7% | -1.4% | 12.2% | 30.6% | 41.5% |
*The xth-percentile wage is the wage at which x% of wage earners earn less and (100-x)% earn more.
Note: Dollars deflated using the CPI-U-RS.
Source: Economic Policy Institute analysis of Current Population Survey Outgoing Rotation Group microdata
This stagnation in wages was driven in large part by policy choices that reduced workers’ bargaining power and lowered labor standards—in particular, policy maker’s failure to adequately raise state and federal minimum wages.2 The erosion of the minimum wage over the past several decades has been acutely damaging for low-wage workers throughout the country, including here in New York. Table 1 shows changes in hourly wages for New York workers at different points in the wage distribution from 1979 to 2014. Over that period, wages at the 10th percentile in New York have fallen by 1.4 percent in inflation-adjusted terms. In other words, someone in New York employed in a job where they earn more than 20 percent of all other workers and less than 80 percent of all workers makes less than someone in a similar job 35 years ago (after adjusting for inflation). In fact, a worker at the 10th percentile in New York today makes 3.7 percent less than the same worker over 35 years ago.
Changes in New York establishments, employment and average pay, fast food versus all industries, 2007 to 2014
| Total New York – All Industries | Combined Limited Service Restaurants and Snack and Nonalcoholic Beverage Bars | |||||
|---|---|---|---|---|---|---|
| Year | Number of establishments | Employment | Average annual pay (2014$) | Number of establishments | Employment | Average annual pay (2014$) |
| 2000 | 527,558 | 8,475,529 | $61,787 | 12,383 | 135,513 | $16,242 |
| 2007 | 573,558 | 8,554,012 | $67,869 | 14,801 | 161,432 | $16,066 |
| 2009 | 580,637 | 8,343,862 | $63,711 | 16,365 | 167,877 | $16,040 |
| 2014 | 621,198 | 8,846,290 | $65,887 | 20,142 | 213,308 | $16,234 |
| Cumulative percentage change | ||||||
| 2000–2007 | 8.7% | 0.9% | 9.8% | 19.5% | 19.1% | -1.1% |
| 2007–2009 | 1.2% | -2.5% | -6.1% | 10.6% | 4.0% | -0.2% |
| 2009–2014 | 7.0% | 6.0% | 3.4% | 23.1% | 27.1% | 1.2% |
| 2007–2014 | 8.3% | 3.4% | -2.9% | 36.1% | 32.1% | 1.0% |
| 2000–2014 | 17.7% | 4.4% | 6.6% | 62.7% | 57.4% | 0.0% |
Note: Dollars deflated using CPI-U-RS. Values reflect annual averages.
Source: Quarterly Census of Employment and Wages, Bureau of Labor Statistics
Changes in New York establishments, employment and average pay in fast food industries, 2007 to 2014
| Limited Service Restaurants (722513) | Snack and Nonalcoholic Beverage Bars (722515) | |||||
|---|---|---|---|---|---|---|
| Year | Number of establishments | Employment | Average annual pay (2014$) | Number of establishments | Employment | Average annual pay (2014$) |
| 2000 | 10,009 | 114,547 | $16,466 | 2,374 | 20,966 | $15,015 |
| 2007 | 11,567 | 128,033 | $15,773 | 3,234 | 33,399 | $17,189 |
| 2009 | 12,821 | 133,865 | $15,704 | 3,544 | 34,012 | $17,361 |
| 2014 | 15,502 | 164,630 | $15,952 | 4,640 | 48,678 | $17,190 |
| Cumulative percentage change | ||||||
| 2000–2007 | 15.6% | 11.8% | -4.2% | 36.2% | 59.3% | 14.5% |
| 2007–2009 | 10.8% | 4.6% | -0.4% | 9.6% | 1.8% | 1.0% |
| 2009–2014 | 20.9% | 23.0% | 1.6% | 30.9% | 43.1% | -1.0% |
| 2007–2014 | 34.0% | 28.6% | 1.1% | 43.5% | 45.7% | 0.0% |
| 2000–2014 | 54.9% | 43.7% | -3.1% | 95.5% | 132.2% | 14.5% |
Note: Dollars deflated using CPI-U-RS. Values reflect annual averages.
Source: Quarterly Census of Employment and Wages, Bureau of Labor Statistics
Wages in the fast-food industry are emblematic of this problem. The industry has grown dramatically in recent years, yet pay in fast food remains exceptionally low, and in fact, adjusted for inflation it is the same—if not lower—today than it was at the start of the millennium. Table 2A shows that growth in the restaurant industry been particularly strong since 2000, with the number of fast-food establishments (both limited service restaurants and snack and nonalcoholic beverage bar) growing by 62.7 percent, compared with only 17.7 percent growth of all establishments in all New York industries. Similarly, employment in fast food has grown 57.4 percent, compared with only 4.4 percent growth in total state employment. Yet average annual pay in fast food in 2014 was essentially identical to what it was in the year 2000. In fact, Table 2B breaks out limited service restaurants and snack and nonalcoholic beverage bars, showing that in limited service restaurants, average annual pay is actually 3.1 percent lower today than it was in 2000.
On an hourly basis, median hourly pay for fast-food workers in 2014 was $9.03 per hour, according to the New York State Department of Labor. This is consistent with data we have from U.S. Bureau of Labor Statistics, which show that median hourly wages of the two primary fast-food occupations—fast-food cooks and combined food preparation and serving workers—range from $8.78 to $9.42 across all metropolitan areas in New York State.3 Here in Albany, front-line food preparation and serving workers in fast food have a median wage of $8.93, while fast food cooks earn $9.25 per hour.
These are wage levels that are grossly inadequate to achieve any semblance of economic security even in the least expensive parts of New York State. For over a decade, the Economic Policy Institute has calculated basic family budgets for over 600 local areas in the United States. These budgets measure how much it costs various representative family types to have a modest, but adequate standard of living in the specific geography where a family lives. The budgets estimate location-specific costs of housing, food, child care, transportation, health care, taxes, and other necessities. However, the family budgets exclude many components that might be considered a middle-class lifestyle. In particular, they do not include any savings whatsoever—no savings for a rainy day (such as the loss of a job or unexpected medical bills), no savings for retirement, and no savings for a child’s education.
Table 3 shows family budgets for individuals and families in New York projected for 2018. In the least expensive area of the state (the Buffalo-Niagara Falls area) the family budget for a single, childless adult in 2018 is $30,335 dollars in annual income. An individual working 40 hours per week, 52 weeks per year, would need an hourly wage of $14.58 per hour to meet this threshold of a modest, but adequate standard of living. It is important to note, however, that workers in the fast-food industry rarely get full-time hours. At the average weekly hours of workers in the New York leisure and hospitality sector (which includes fast food), a single, childless worker would need to make $20.91 per hour to have an adequate standard of living in the Buffalo-Niagara Falls region.4 Here in Albany, a full-time, year-round worker would need to earn $16.40 per hour to achieve modest economic security, or $23.52 at current average weekly hours in the fast-food industry.
Family budgets in New York, by region and family type (2018$)
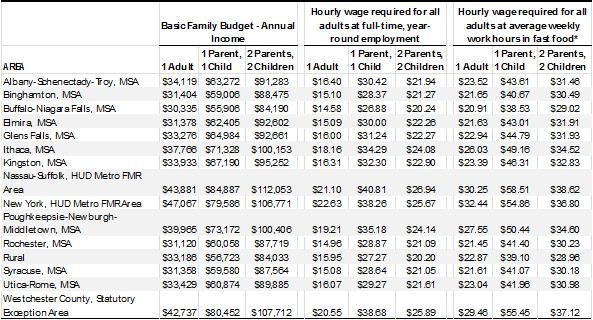
Note: *Assumes fast-food workers average 27.9 hours of work per week, 52 weeks per year. See footnote 4 for further details. Dollars inflated from 2014 dollar values to 2018 using Congressional Budget Office projections for growth in the Consumer Price Index.
Source: EPI Family Budget data from forthcoming update to Family Budget Calculator. Average weekly work hours in fast food from February 2015 Current Employment Statistics for New York Leisure and Hospitality Sector, published by the Bureau of Labor Statistics.
Given that nearly three-quarters of fast-food workers are age 22 or older, it is reasonable to assume that a substantial portion of these workers have children and families.5 For parents, wages in the fast food sector are even more inadequate. In a two-parent, two-child family, both parents would need to earn wages ranging from $20.24 an hour in the Buffalo area to nearly $27 per hour in Nassau and Suffolk counties to meet the family budget’s threshold of a modest, but adequate standard of living—assuming they both work full-time, year-round. At current average weekly hours in the fast-food industry, that same couple would need hourly wages ranging from $29 an hour in Buffalo to $38.62 in Nassau-Suffolk. Here in Albany, two parents working full-time and year-round would need to earn nearly $22 per hour by 2018 to meet the family budget, or over $31 per hour at current average hours in fast food.
Because wages in the fast-food industry are so far from what is needed, workers in the industry often are forced to rely on public assistance programs such as Medicaid, the Supplemental Nutrition Assistance Program (SNAP or “food stamps”), Temporary Assistance to Needy Families (TANF), or the Federal Earned Income Tax Credit (EITC) in order to afford their basic needs. In fact, restaurant and food services has the highest proportion of its workforce relying on public assistance of any industry.6 A 2013 study from the University of California, Berkeley and the University of Illinois estimated that 60 percent of New York’s fast-food workers relied on some form of government assistance program, at an annual cost of $708 million to taxpayers over the 2007 to 2011 period. Because fast-food employment in New York has grown nearly 22 percent since that time and average annual pay for the industry is essentially unchanged, public assistance costs have likely grown proportionately. This would imply a total annual cost of $862 million borne by taxpayers today. Adding in the New York State EITC brings the total to $903 million per year, of which $332 million comes directly from New York State.7
To be clear, public assistance programs such as these are vital safety net programs that protect many workers and families from undue material hardship. But these programs were not created so that profitable corporations could adopt a business model of paying inadequate wages with the knowledge that government programs and taxpayers will pick up the slack.
That is why the wage board should be wary of calls to expand public assistance programs such as the Earned Income Tax Credit as a substitute for raising wage standards for the industry. First of all, not all workers qualify for the EITC as it is currently designed—a childless individual will not qualify for the EITC if they earn just $15,000 a year. Second, there is excellent research showing that because the EITC encourages more people in low-income families to work, it has the effect of lowering the wages that would be paid otherwise by employers if it is not accompanied by an increase in the wage floor. A 2010 study in the American Economic Journal estimated that employers effectively capture 27 cents of every dollar spent on the EITC.8 Increasing EITC benefits or expanding eligibility may be worthwhile, but any expansion should be done in tandem with a higher wage floor. Otherwise a large portion of those dollars will simply be a give-away to an industry that already receives enormous public subsidy.

Finally, I’m sure that this board has heard or will hear arguments that increasing the minimum wage in fast food will lead to job losses or slower job creation. There is an enormous body of literature on the effect of higher minimum wages on jobs. Figure B shows the results of a “meta-study,” a study of studies, of 64 research papers on the minimum wage between 1972 and 2007. The X-axis shows the effect on employment resulting from a minimum wage increase; the Y-axis shows the statistical rigor of the study. As you can see, the results of the vast majority of analyses cluster around zero, and those with the highest statistical power—i.e., the most rigorous studies—all fall on the zero line.9
There have also been other highly rigorous papers published since 2007 confirming this finding—including one that examined what happened at the county level after every single minimum wage increase in the United States from 1990 to 2006, concluding that there were “strong earnings effects and no employment effects from a minimum wage increase.”
This was also the conclusion of more than 600 Ph.D. economists, including seven Nobel Prize winners, who sent a letter to Congress last year encouraging them to raise the federal minimum wage.10 The letter states: “In recent years there have been important developments in the academic literature on the effect of increases in the minimum wage on employment, with the weight of evidence now showing that increases in the minimum wage have had little or no negative effect on the employment of minimum-wage workers, even during times of weakness in the labor market.”
This is not to say that the minimum wage in fast food could be raised infinitely high overnight, but it should make clear that business’ ability to accommodate higher wage floors has always been far greater than they or their advocates will admit. In fact, a recent paper by researchers at the University of Massachusetts outlines how the fast food industry specifically could absorb a $15 minimum wage within a reasonable timeframe without reducing employment or average firm profitability.11
Conclusion
Within three years, a single individual working full-time and year-round in the least expensive area of New York State will need an hourly wage of roughly $15 per hour to achieve a modest, but adequate standard of living. Wages in New York’s fast-food industry are currently so far from this level that a majority of fast-food employees must rely on public assistance programs in order to make ends meet. This implicit public subsidy to the fast-food industry amounts to over $900 million a year, money that might otherwise be leveraged to enhance anti-poverty programs or make investments in education and infrastructure that would support new job creation and strengthen long-term growth.
Establishing a minimum wage in fast food that ensures workers will be able to afford a decent quality of life would raise living standards for hundreds of thousands of New York workers and their families. It would also likely lead to wage increases in other sectors of the New York economy and could help spur the more broad-based wage growth that has eluded low-wage workers in New York for over a decade.
Endnotes
1. Nonsupervisory, production workers excludes executives and other high-paid managers, comprising roughly 80 percent of the total workforce.
2. For a detailed description of this problem and its causes, see Bivens, Gould, Mishel, and Shierholz Raising America’s Pay: Why It’s Our Central Economic Policy Challenge, Economic Policy Institute Briefing Paper #378, June 4, 2014.
3. U.S. Bureau of Labor Statistics, Occupational Employment Statistics, May 2014.
4. Average weekly hours in New York’s Leisure and Hospitality sector, which includes limited service restaurants (fast food), come from the February 2015 release of Current Employment Statistics data from the Bureau of Labor Statistics (BLS). BLS does not publish state-level data on average weekly hours in the limited service restaurant industry; however, they do publish national average weekly hours in limited service restaurants. In February 2015, average weekly hours in limited service restaurants nationally was 25.2 hours, while average hours in the larger leisure and hospitality sector were 26.2. Thus, using the leisure and hospitality hours for New York State may, in fact, overstate typical hours in fast food employment, and thereby understate the wage required in typical fast food employment to meet the family budget.
5. 72 percent of fast food workers are age 22 or older according to NYSDOL, Briefing Document on Employment and Wages in New York State’s Fast-Food Restaurants, p. 5.
6. Sylvia Allegretto, Marc Doussard, Dave Grahan-Squire, Ken Jacobs, Dan Thompson, and Jeremy Thompson, Fast Food, Poverty Wages. The Public Cost of Low-Wage Jobs in the Fast-Food Industry, University of California Berkeley Labor Center and University of Illinois at Urban- Champaign, October 15, 2013.
7. Calculations made by James Parrott, Ph.D., Chief Economist at the Fiscal Policy Institute and submitted in testimony to the NYS Fast Food Wage Board hearing in Buffalo on June 5, 2015.
8. Jesse Rothstein, “Is the EITC as Good as an NIT? Conditional Cash Transfers and Tax Incidence,” American Economic Journal: Economic Policy, vol. 2, no. 1 (February 2010), pp. 177–208, http://www.jstor.org/stable/25760056.
9. For an excellent summary of the minimum wage literature, see Schmitt, John. Why Does the Minimum Wage Have No Discernible Effect on Employment?, Center for Economic and Policy Research.
10. Letter to President Obama, Speaker Boehner, Majority Leader Reid, Congressman Cantor, Senator McConnell, and Congresswoman Pelosi. January 14, 2014.
11. Robert Rollin and Jeannette Wicks-Lim, A $15 U.S. Minimum Wage: How the Fast-Food Industry Could Adjust Without Shedding Jobs, University of Massachusetts Political Economy Research Institute, January 2015.
